
Time Total number (hr) of cells Exponential Growth B 2 25 816 5 勇 A growth experiment 512 1.024 2,048 beginning with a single 85 4.096 cell having a doubling a 10 1.048.576 time of 30 min is 1000 1000 presented.This pattern Logarithmic Arithmetic of population increase, 100 Number of cells where the number of 500 Number of cells (arithmetic scale) (logarithmic scale) 10 cells doubles during 100 each unit time period. 上1LLLL 012346 is referred to as Time(hr) exponential growth The rate of growth of a microbial culture. 8Bara89a。 logarithmic(right ordinate)scale
A growth experiment beginning with a single cell having a doubling time of 30 min is presented. This pattern of population increase, where the number of cells doubles during each unit time period, is referred to as exponential growth. Exponential Growth
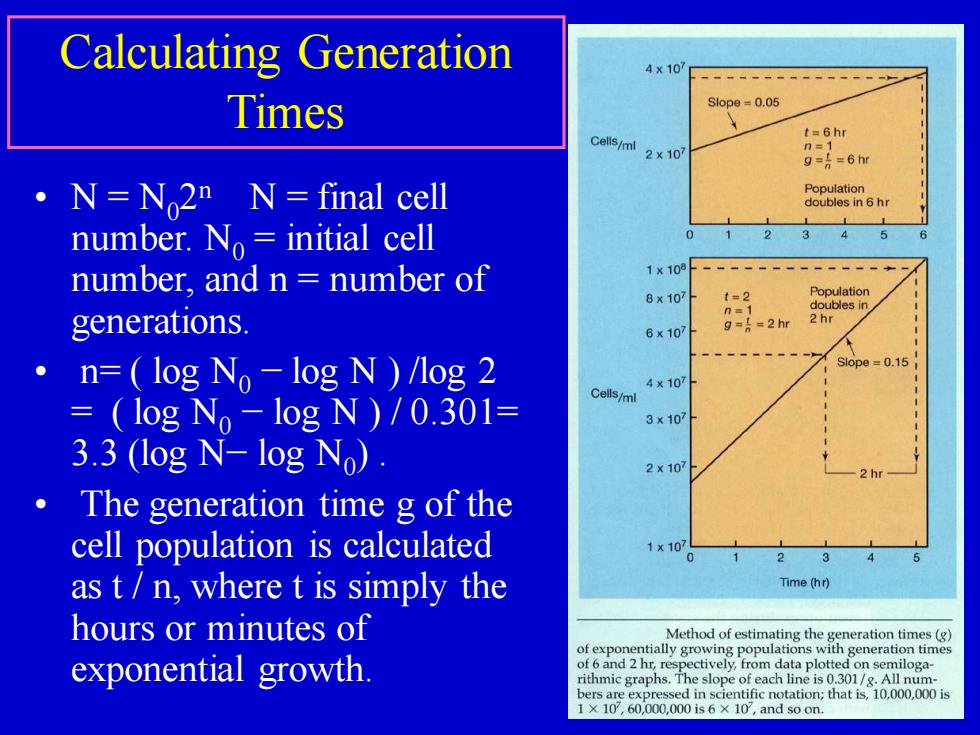
Calculating Generation 4×10⁷-y Times Slope =0.05 Cells/ml 2x10 t=6hr 7=1 g=I=6hr ·N=N2nN=final cell Population doubles in 6 hr number.No initial cell 3 4 5 number,and n number of 1x10⁸ 8×10⁷ t=2 Population n=1 doubles in generations. 2hr 6×10⁷ g==2hr n=(log No log N)/log 2 Slope =0.15 4×10⁷ (log No -log N)/0.301= Cells/ml 3×10⁷ 3.3 (log N-log No) 2×10⁷ The generation time g of the cell population is calculated 1x10⁷ 0 2 3 as t/n,where t is simply the Time(hr) hours or minutes of exponential growth. of 6 and 2 hr,respectively,from data plotted on semiloga- rithmic graphs.The slope of each line is 0.301/g.All num- bers are expressed in scientific notation;that is,10,000,000 is 1×10,60,000,000is6×10,and so on
• N = N0 2 n N = final cell number. N0 = initial cell number, and n = number of generations. • n= ( log N0 − log N ) /log 2 = ( log N0 − log N ) / 0.301= 3.3 (log N− log N0 ) . • The generation time g of the cell population is calculated as t / n, where t is simply the hours or minutes of exponential growth. Calculating Generation Times
Growth Cycle of Populations Growth phases Expondntia】 Stationary Death 10.0 1.0 Logio viable 90 Turbidity 0.8 organisms/ml Viable count (optical density】 8.0 0.6 Optical 7.0 density 0.4 6.0 5.0 Time A typical growth curve for a population of cells can be divided into several distinct phases called the lag phase,exponential phase,stationary phase,and death phase
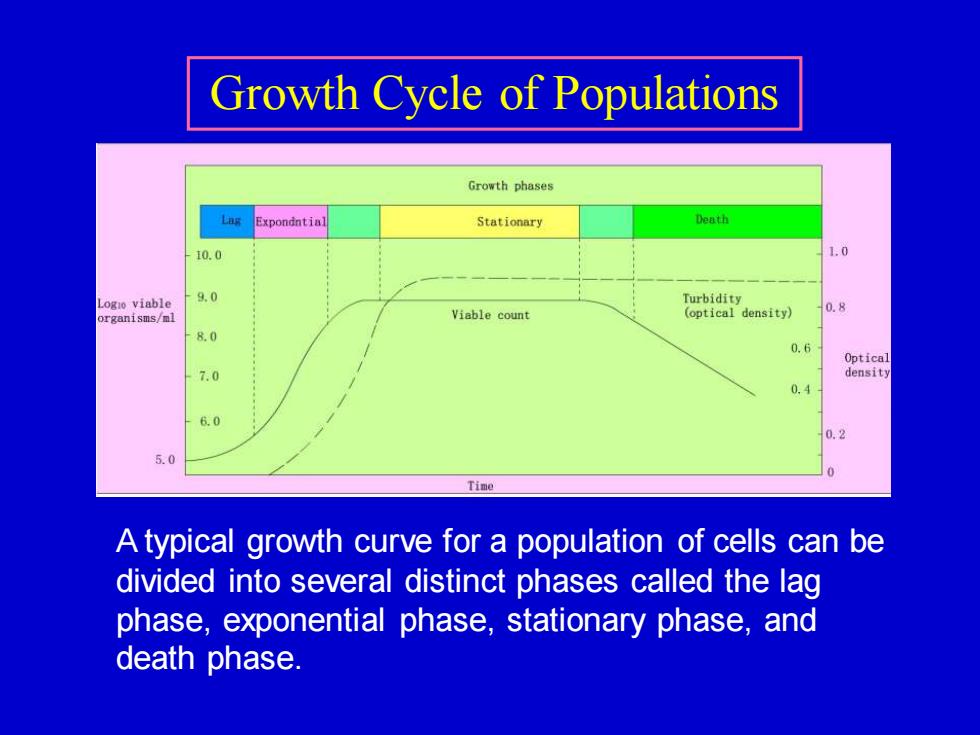
Growth Cycle of Populations A typical growth curve for a population of cells can be divided into several distinct phases called the lag phase, exponential phase, stationary phase, and death phase
Growth curve of bacteria 1.Lag Phase 2.Exponential Phase 3.Stationary Phase elapeq 4.Death Phase time
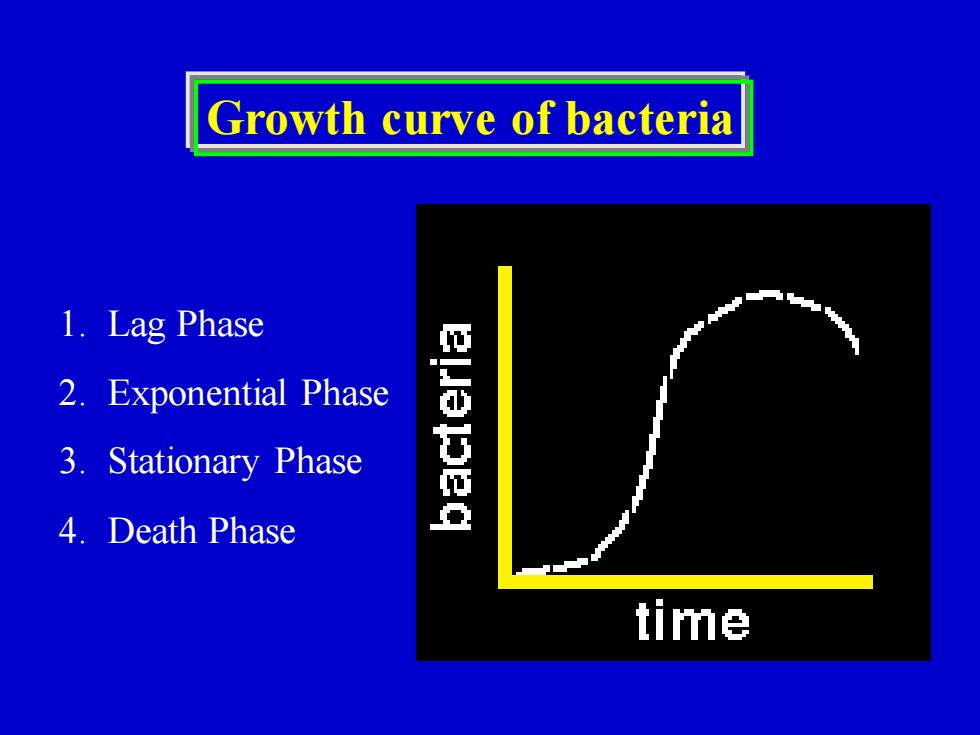
Growth curve of bacteria 1. Lag Phase 2. Exponential Phase 3. Stationary Phase 4. Death Phase
Lag Phase When a microbial population is inoculated into a fresh medium,growth usually does not begin immediately but only after a period of time called the lag phase,which may be brief or extended depending on the history of the culture and growth conditions. This happens because for growth to occur in a particular culture medium the cells must have a complete complement of enzymes for synthesis of the essential metabolites not present in that medium
Lag Phase When a microbial population is inoculated into a fresh medium, growth usually does not begin immediately but only after a period of time called the lag phase, which may be brief or extended depending on the history of the culture and growth conditions. This happens because for growth to occur in a particular culture medium the cells must have a complete complement of enzymes for synthesis of the essential metabolites not present in that medium