成 ION CONCENTRATIONS1 INSIDE AND OUTSIDE OF RESTING MYOCYTES ION INSIDE (mM) OUTSIDE (mM) Na 20 145 K 150 4 Ca" 0.001 2.5 C 25 140 人民只生公版松
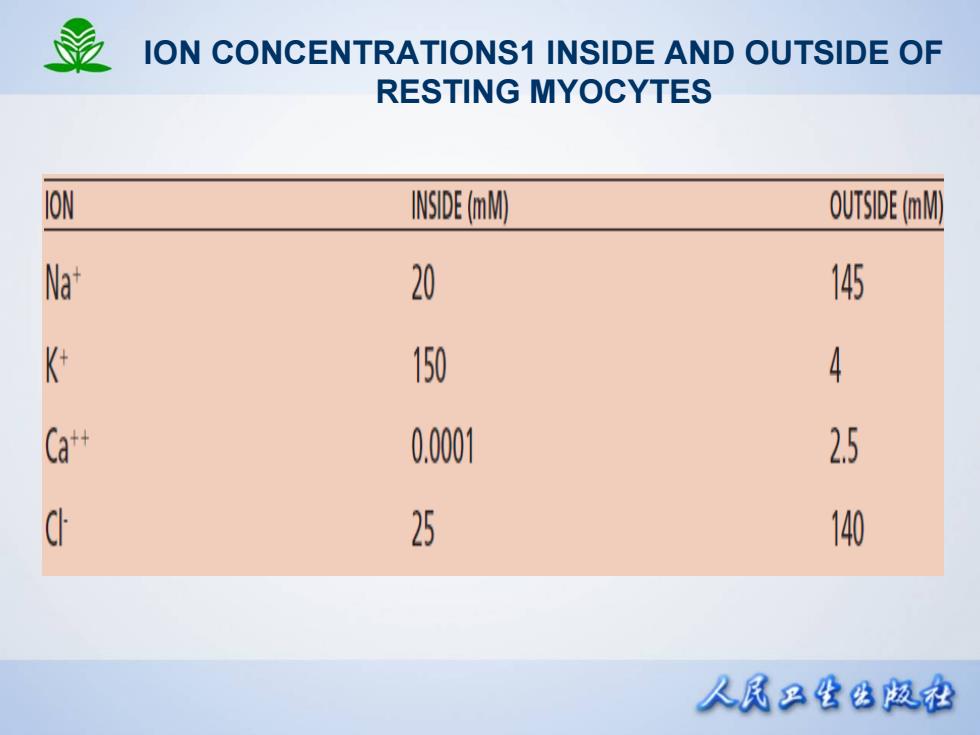
ION CONCENTRATIONS1 INSIDE AND OUTSIDE OF RESTING MYOCYTES
Schematic diagram of the ion permeability changes and transport processes that occur during an action potential and the diastolic period following it 0mV 3 0 100ms 4 -85mV Na+ Ca2+ Na+ Na+ Na+Ca2+ Outside Membrane ATP Inside Ca2+ K1+ Diastolic channel K+ Pump Exchanger currents 人凤只公8版松
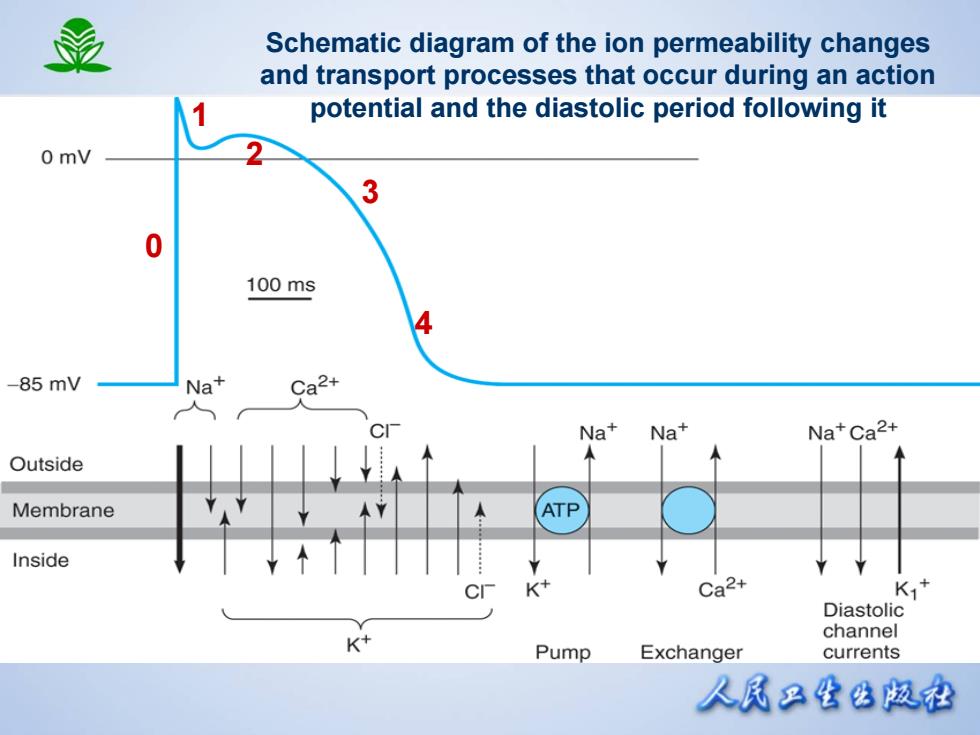
Schematic diagram of the ion permeability changes and transport processes that occur during an action potential and the diastolic period following it 0 1 2 3 4
能 Comparison of action potentials from a nerve cell and a nonpacemaker cardiac myocyte +50 Nerve Cell Cardiac Myocyte 0 -50- -100 0 500 Time(ms)) 人凤只生公松
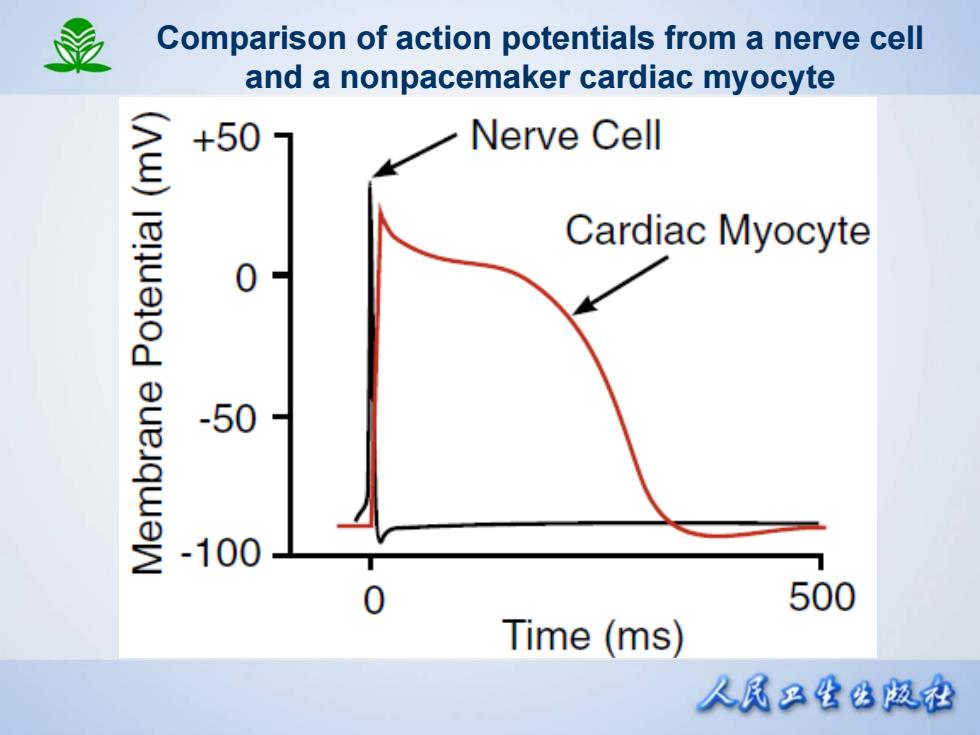
Comparison of action potentials from a nerve cell and a nonpacemaker cardiac myocyte
动作电位0期 (40) 20 0 分mG -20 A之e -80 0 150 300 Time (ms) 人民只生B版松
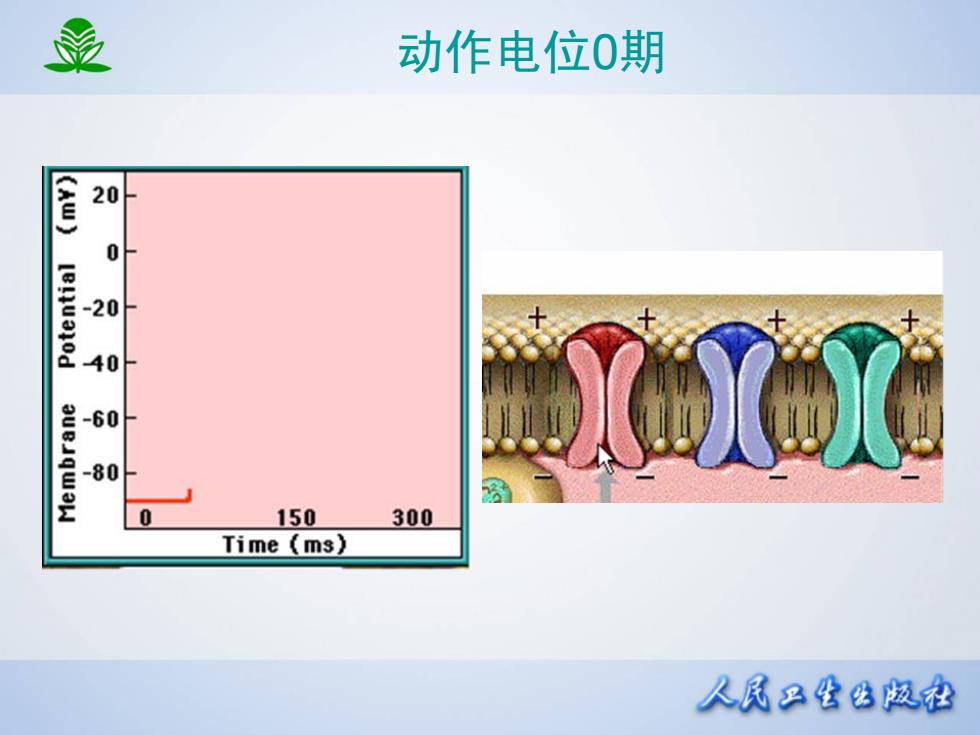
动作电位 0 期
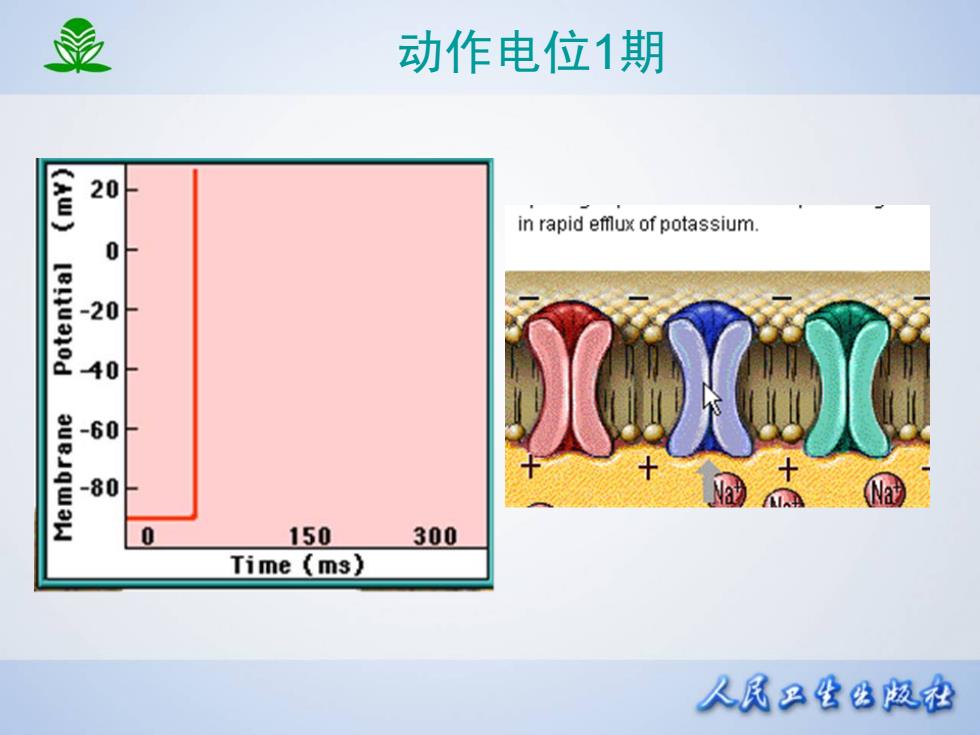
能 动作电位1期 (A0) in rapid efflux of potassium. 0 -20 -60 -80 0 150 300 Time (ms) 人民只坐公版松
动作电位 1 期