
o,and o,Known (continued) Population means, independent The test statistic for samples μ1-2is: o,and o2 known (风1-X2)-(山,-2) o,and o2 unknown n n2 Statistics for Managers Using Microsoft Excel Chap9-11
Statistics for Managers Using Microsoft Excel Chap 9-11 Population means, independent samples σ1 and σ2 known 2 2 2 1 2 1 1 2 1 2 n σ n σ X X μ μ Z The test statistic for μ1 – μ2 is: σ1 and σ2 Known σ1 and σ2 unknown (continued)

Hypothesis Tests for Two Population Means Two Population Means,Independent Samples Two-tail test: Lower-tail test: Upper-tail test: Ho:μ1=2 Ho:μ122 Ho:μ1≤2 H1:1≠2 H1μ1<2 H1:μ1>2 i.e. i.e., i.e., Ho1-2=0 Hoμ1-2≥0 Ho:μ1-μ2≤0 H1:μ1-2≠0 H1:1-2<0 H1:μ1-2>0 Statistics for Managers Using Microsoft Excel Chap 9-12
Statistics for Managers Using Microsoft Excel Chap 9-12 Hypothesis Tests for Two Population Means Lower-tail test: H0: μ1 μ2 H1: μ1 < μ2 i.e., H0: μ1 – μ2 0 H1: μ1 – μ2 < 0 Upper-tail test: H0: μ1 ≤ μ2 H1: μ1 > μ2 i.e., H0: μ1 – μ2 ≤ 0 H1: μ1 – μ2 > 0 Two Population Means, Independent Samples Two-tail test: H0: μ1 = μ2 H1: μ1 ≠ μ2 i.e., H0: μ1 – μ2 = 0 H1: μ1 – μ2 ≠ 0

Hypothesis tests forμ1-μ2 Two Population Means,Independent Samples Two-tail test: Lower-tail test: Upper-tail test: H0μ1-μ2=0 Ho:μ1-2≥0 Ho:1-2≤0 H1:μ1-2≠0 H:1-2<0 H1:μ1-2>0 Za2 Za Reject Ho if Z<-Za2 Reject Ho if Z<-Z Reject Ho if Z>Zo or Z Za2 Statistics for Managers Using Microsoft Excel Chap 9-13
Statistics for Managers Using Microsoft Excel Chap 9-13 Two Population Means, Independent Samples Lower-tail test: H0: μ1 – μ2 0 H1: μ1 – μ2 < 0 Upper-tail test: H0: μ1 – μ2 ≤ 0 H1: μ1 – μ2 > 0 -z z Reject H0 if Z < -Z Reject H0 if Z > Z Hypothesis tests for μ1 – μ2 Two-tail test: H0: μ1 – μ2 = 0 H1: μ1 – μ2 ≠ 0 /2 /2 -z/2 z/2 Reject H0 if Z < -Z/2 or Z > Z/2
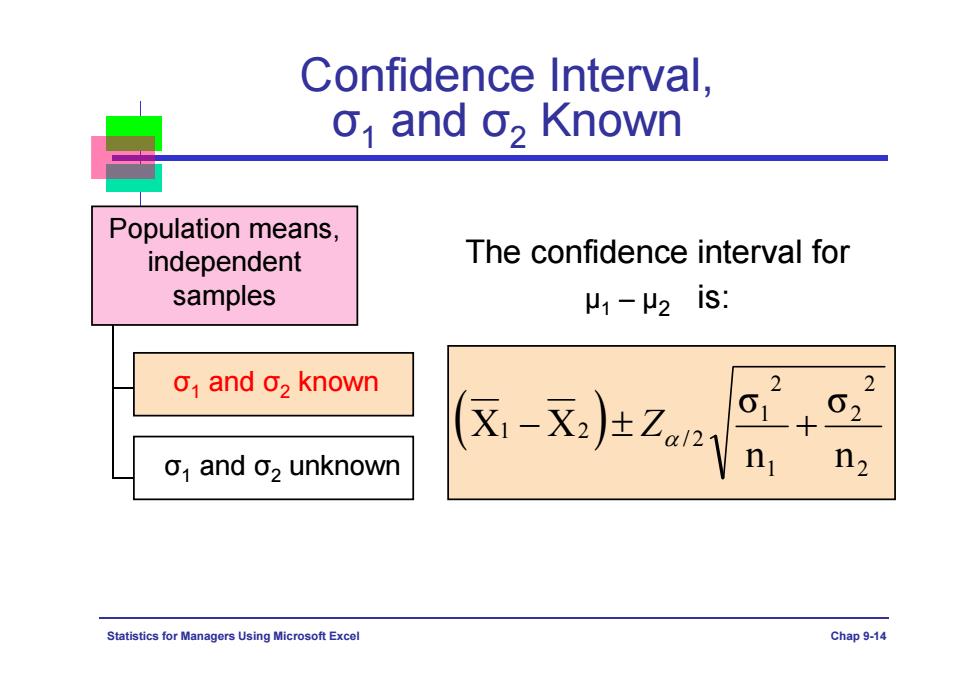
Confidence Interval, o,and o,Known Population means, independent The confidence interval for samples μ1-2iS: o,and o2 known 2 2 61 62 o1 and o2 unknown -x±Zy 12 Statistics for Managers Using Microsoft Excel Chap 9-14
Statistics for Managers Using Microsoft Excel Chap 9-14 Population means, independent samples σ1 and σ2 known 2 2 2 1 2 1 / 2 1 2 n σ n σ X X Z The confidence interval for μ1 – μ2 is: Confidence Interval, σ1 and σ2 Known σ1 and σ2 unknown

Excel:Z-test for two samples for mean EXCEL→tool>data Analysis→Z-test:Two Sample for Means z-Test:Two Sample for Means Normal End-aisle Mean 50.3 72 Known Variance ¥ 6 Observations 10 10 Hypothesized Mean Difference 0 -21.7 P(Z<=z)one-tail 0 z Critical one-tail 1.644853627 P(Z<=z)two-tail 0 z Critical two-tail 1.959963985 z-test for two sample for means.xls Statistics for agers Using Microsoft Excel Chap 9-15
Statistics for Managers Using Microsoft Excel Chap 9-15 Excel: Z-test for two samples for mean EXCELtooldata AnalysisZ-test: Two Sample for Means z-Test: Two Sample for Means Normal End-aisle Mean 50.3 72 Known Variance 4 6 Observations 10 10 Hypothesized Mean Difference 0 z -21.7 P(Z<=z) one-tail 0 z Critical one-tail 1.644853627 P(Z<=z) two-tail 0 z Critical two-tail 1.959963985 z-test for two sample for means.xls