CHAPTER 11 FATIGUE,CREEP AND FRACTURE Summary Fatigue loading is generally defined by the following parameters stress range,o,=20a mean stress,om =(omax +omin) alternating stress amplitude,a=(omax-omin) When the mean stress is not zero stress ratio,R=Omin Omax The fatigue strength oN for N cycles under zero mean stress is related to that oa under a condition of mean stress om by the following alternative formulae: Oa ON[1-(om/ors)](Goodman) Oa =oN[1-(am/OTs)2](Geber) da ON[1-(om/oy)](Soderberg) where ors tensile strength and oy=yield strength of the material concerned.Applying a factor of safety F to the Soderberg relationship gives =-(%。,P】 Theoretical elastic stress concentration factor for elliptical crack of major and minor axes A and B is K,=1+2A/B The relationship between any given number of cycles n at one particular stress level to that required to break the component at the same stress level N is termed the"stress ratio" (n/N).Miner's law then states that for cumulative damage actions at various stress levels: ++ n1 n3 +…+etc.=1 The Coffin-Manson law relating the plastic strain range Asp to the number of cycles to failure N is: △ep=K(Nf)b 443
CHAPTER 11 FATIGUE, CREEP AND FRACTURE Summary Fatigue loading is generally defined by the following parameters stress range, a, = 2a, mean stress, a,,, = Z(a,,,ax + a,,,,,) alternating stress amplitude, a, = (arna - ami,) 1 When the mean stress is not zero amin amax stress ratio, R, = - The fatigue strength CN for N cycles under zero mean stress is related to that a, under a condition of mean stress am by the following alternative formulae: a, = a~[1 - (am/a~s)] a, = a~[l - (am/a~~)2] a, = a~[l - (am/ay)] (Goodman) (Geber) (Soderberg) where CTTS = tensile strength and ay = yield strength of the material concerned. Applying a factor of safety F to the Soderberg relationship gives a, = “N [l- (31 am F) F Theoretical elastic stress concentration factor for elliptical crack of major and minor axes A ahd B is Kt = 1 + 2A/B The relationship between any given number of cycles n at one particular stress level to that required to break the component at the same stress level N is termed the “stress ratio” (n/N). Miner’s law then states that for cumulative damage actions at various stress levels: nl n2 n3 -+-+-+... + etc. = 1 N1 N2 N3 The Coffin-Manson law relating the plastic strain range failure Nf is: to the number of cycles to AS, = K(Nf)-b or -b AE~ = (%) 443

444 Mechanics of Materials 2 where D is the ductility,defined in terms of the reduction in area r during a tensile test as D= 1-r The total strain range elastic plastic strain ranges i.e. △er=△ee+△ep the elastic range being given by Basquin's law △ee= 3.505.N012 E Under creep conditions the secondary creep rate s is given by the Arrhenius equation where H is the activation energy,R the universal gas constant,T the absolute temperature and Aa constant. Under increasing stress the power law equation gives the secondary creep rate as e9=Bo” with B and n both being constants. The latter two equations can then be combined to give The Larson-Miller parameter for life prediction under creep conditions is P1=T(logiot +C) The Sherby-Dorn parameter is P2 log1ofr-T and the Manson-Haferd parameter T-Ta P3= log10 tr -logio ta where tr=time to rupture and Ta and logio ta are the coordinates of the point at which graphs of T against logio tr converge.C and a are constants. For stress relaxation under constant strain 1.1 -T+BE(n 1)t 0h-1三 where o is the instantaneous stress,oi the initial stress,B and n the constants of the power law equation,E is Young's modulus and t the time interval. Griffith predicts that fracture will occur at a fracture stress of given by 2bEy o}= πa(1-v2) for plane strain
444 Mechanics of Materials 2 where D is the ductility, defined in terms of the reduction in area r during a tensile test as D=1, (-) 1 1-r The total strain range = elastic + plastic strain ranges i.e. the elastic range being given by Basquin's law AS, = AE, + AE~ Under creep conditions the secondary creep rate E: is given by the Arrhenius equation E, 0 =Ae (-x) where H is the activation energy, R the universal gas constant, T the absolute temperature and A a constant. Under increasing stress the power law equation gives the secondary creep rate as &; = pa" with p and n both being constants. The latter two equations can then be combined to give E; = Ka"e (-k) The Larson -Miller parameter for life prediction under creep conditions is PI = T(log1, tr + C) The Sherby-Dorn parameter is a Pz = log,,tr - - T and the Manson-Haferd parameter where tr = time to rupture and T, and log,, t, are the coordinates of the point at which graphs of T against log,, tr converge. C and cx are constants. For stress relaxation under constant strain where a is the instantaneous stress, oi the initial stress, /? and n the constants of the power law equation, E is Young's modulus and t the time interval. Grifith predicts that fracture will occur at a fracture stress of given by 2bE y of 2 = for plane strain na(1 - U*)
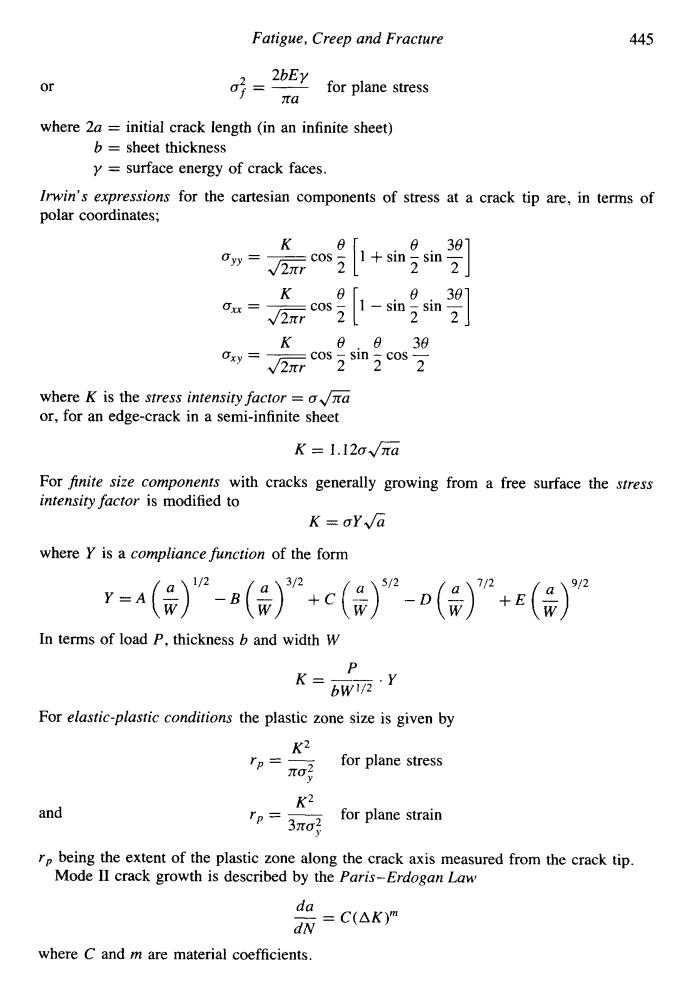
Fatigue,Creep and Fracture 445 2bEy or for plane stress a where 2a initial crack length(in an infinite sheet) b sheet thickness y surface energy of crack faces. Irwin's expressions for the cartesian components of stress at a crack tip are,in terms of polar coordinates; K 8.381 √2πr -2 1+sin sin2 K .301 Ox=- 2πr 1-sin 2 sin2 K 30 Oxy=- cos sin-Cos 2πr 22 2 where K is the stress intensiry factor=o√πa or,for an edge-crack in a semi-infinite sheet K=1.12o√πa For finite size components with cracks generally growing from a free surface the stress intensity factor is modified to K=oY√a where Y is a compliance function of the form 12 3/2 、7/2 9/2 Y=A a a W -B c() +E W) In terms of load P,thickness b and width W P K bW2·P For elastic-plastic conditions the plastic zone size is given by K2 rp=- o for plane stress K2 and rp= 3no for plane strain rp being the extent of the plastic zone along the crack axis measured from the crack tip. Mode II crack growth is described by the Paris-Erdogan Law da dN :=C(△K)m where C and m are material coefficients
Fatigue, Creep and Fracture 445 or for plane stress 2 2bEY Of = - na where 2a = initial crack length (in an infinite sheet) b = sheet thickness y = surface energy of crack faces. Irwin’s expressions for the Cartesian components of stress at a crack tip are, in terms of polar coordinates; ayy = - cos - 1 + sin sin ”1 -2 e[ 22 a,, = - cos - 1 - sin - sin - -2 e[ 22 e 37 K e e 3e G222 Oxy = - cos - sin - cos - where K is the stress intensity factor = 06 or, for an edge-crack in a semi-infinite sheet K = 1.12a& For finite size components with cracks generally growing from a free surface the stress intensity factor is modified to K=aY& where Y is a compliance function of the form In terms of load P, thickness b and width W P bW1/2 K=----.Y For elastic-plastic conditions the plastic zone size is given by K2 rp = - for plane stress nay2 and K2 rp = - for plane strain 3na; rp being the extent of the plastic zone along the crack axis measured from the crack tip. Mode I1 crack growth is described by the Paris-Erdogan Law da - = C(AK)* dN where C and m are material coefficients

446 Mechanics of Materials 2 §11.1 11.1.Fatigue Introduction Fracture of components due to fatigue is the most common cause of service failure, particularly in shafts,axles,aircraft wings,etc..where cyclic stressing is taking place.With static loading of a ductile material,plastic flow precedes final fracture,the specimen necks and the fractured surface reveals a fibrous structure,but with fatigue,the crack is initiated from points of high stress concentration on the surface of the component such as sharp changes in cross-section,slag inclusions,tool marks,etc.,and then spreads or propagates under the influence of the load cycles until it reaches a critical size when fast fracture of the remaining cross-section takes place.The surface of a typical fatigue-failed component shows three areas,the small point of initiation and then,spreading out from this point,a smaller glass-like area containing shell-like markings called "arrest lines"or "conchoidal markings" and,finally,the crystalline area of rupture. Fatigue failures can and often do occur under loading conditions where the fluctuating stress is below the tensile strength and,in some materials,even below the elastic limit. Because of its importance,the subject has been extensively researched over the last one hundred years but even today one still occasionally hears of a disaster in which fatigue is a prime contributing factor. 11.1.1.The SIN curve Fatigue tests are usually carried out under conditions of rotating-bending and with a zero mean stress as obtained by means of a Wohler machine. From Fig.11.1,it can be seen that the top surface of the specimen,held "cantilever fashion"in the machine,is in tension,whilst the bottom surface is in compression.As the specimen rotates,the top surface moves to the bottom and hence each segment of the surface moves continuously from tension to compression producing a stress-cycle curve as shown in Fig.11.2. Main beoring Ball race Motor Chuck Load Specimen Fig.11.1.Single point load arrangement in a Wohler machine for zero mean stress fatigue testing. In order to understand certain terms in common usage,let us consider a stress-cycle curve where there is a positive tensile mean stress as may be obtained using other types of fatigue machines such as a Haigh "push-pull"machine
446 Mechanics of Materials 2 511.1 11.1. Fatigue Introduction Fracture of components due to fatigue is the most common cause of service failure, particularly in shafts, axles, aircraft wings, etc., where cyclic stressing is taking place. With static loading of a ductile material, plastic flow precedes final fracture, the specimen necks and the fractured surface reveals a fibrous structure, but with fatigue, the crack is initiated from points of high stress concentration on the surface of the component such as sharp changes in cross-section, slag inclusions, tool marks, etc., and then spreads or propagates under the influence of the load cycles until it reaches a critical size when fast fracture of the remaining cross-section takes place. The surface of a typical fatigue-failed component shows three areas, the small point of initiation and then, spreading out from this point, a smaller glass-like area containing shell-like markings called “arrest lines” or “conchoidal markings” and, finally, the crystalline area of rupture. Fatigue failures can and often do occur under loading conditions where the fluctuating stress is below the tensile strength and, in some materials, even below the elastic limit. Because of its importance, the subject has been extensively researched over the last one hundred years but even today one still occasionally hears of a disaster in which fatigue is a prime contributing factor. 11 .I .I. The SIN curve Fatigue tests are usually carried out under conditions of rotating - bending and with a zero mean stress as obtained by means of a Wohler machine. From Fig. 11.1, it can be seen that the top surface of the specimen, held “cantilever fashion” in the machine, is in tension, whilst the bottom surface is in compression. As the specimen rotates, the top surface moves to the bottom and hence each segment of the surface moves continuously from tension to compression producing a stress-cycle curve as shown in Fig. 11.2. Main beoring / Boll race Chuck Saecimen Fig. I I .I. Single point load arrangement in a Wohler machine for zero mean stress fatigue testing. In order to understand certain terms in common usage, let us consider a stress-cycle curve where there is a positive tensile mean stress as may be obtained using other types of fatigue machines such as a Haigh “push-pull” machine

§11.1 Fatigue,Creep and Fracture 447 Revs 4 Fig.11.2.Simple sinusoidal (zero mean)stress fatigue curve,"reversed-symmetrical". Stress amplitude Stress range m0 m Meon stress 0 Time (t) Fig.11.3.Fluctuating tension stress cycle producing positive mean stress. The stress-cycle curve is shown in Fig.11.3,and from this diagram it can be seen that: Stress range,or =20a. (11.1) Mean stress,om cmax十cmin (11.2) 2 Alternating stress amplitude,o= Omax -Omin (11.3) 2 If the mean stress is not zero,we sometimes make use of the "stress ratio"R,where R:=Omin (11.4) Omax The most general method of presenting the results of a fatigue test is to plot a graph of the stress amplitude as ordinate against the corresponding number of cycles to failure as
311.1 Fatigue, Creep and Fracture 447 Fig. 1 1.2. Simple sinusoidal (zero mean) stress fatigue curve, “reversed-symmetrical”. t I 0 Time (t) Fig. 11.3. Fluctuating tension stress cycle producing positive mean stress. The stress-cycle curve is shown in Fig. 11.3, and from this diagram it can be seen that: Stress range, a, = 2a,. (11.1) amax + amin 2 Mean stress, a,,, = (11.2) (11.3) amax - amin 2 Alternating stress amplitude, a, = If the mean stress is not zero, we sometimes make use of the “stress ratio” R, where (11.4) The most general method of presenting the results of a fatigue test is to plot a graph of the stress amplitude as ordinate against the corresponding number of cycles to failure as amin R, = - amax