
436 The Journal Finance 10 26.0 号 06.0 。 c 器 VOI 85.0 t 15.0- 黑 品 0 ⊙ 8 9 2 器 0 三 6 05.0- 马 8 吃 ⑧ 9 三 80- 8 月 的 品 是 II alqeL 066I aqwraad o1 896I Am ay1 Jo sol!oop A05 6-7 so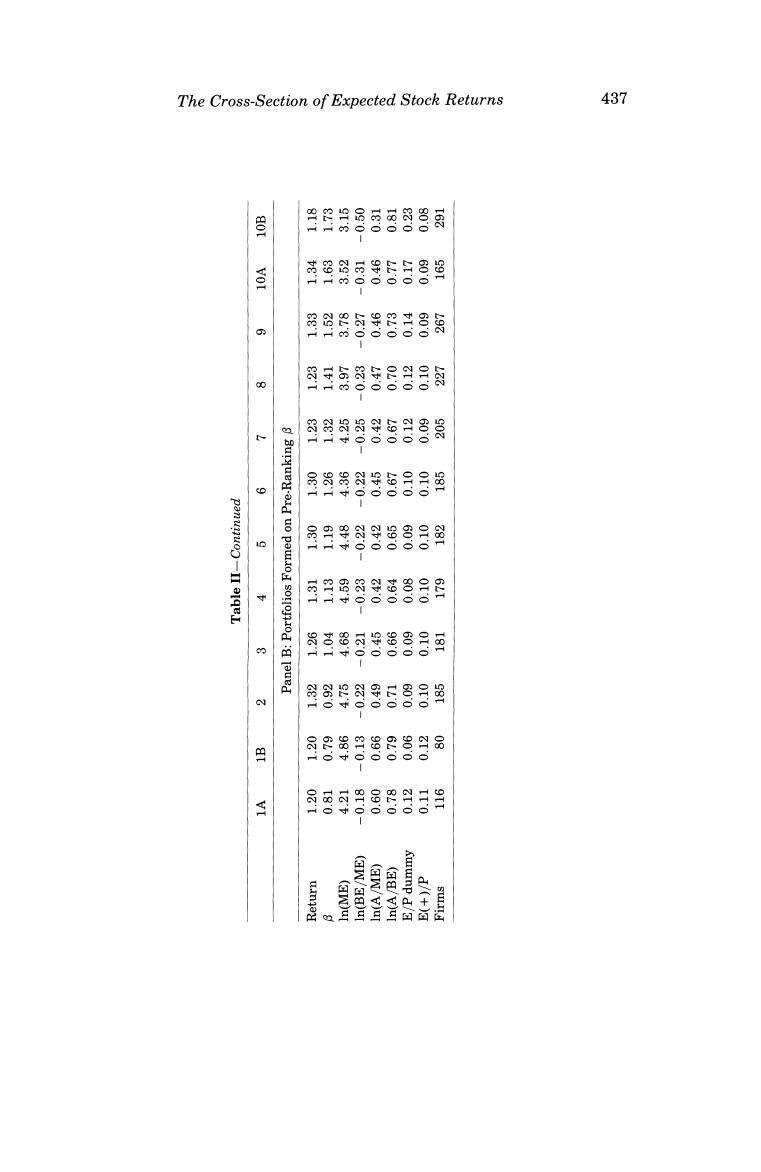
The Cross-Section of Expected Stock Returns 437 9程月 8 VOL 苗留得 g58 朋8为 % 士闲 。s 的于 的 o g月N m 闲器的胡¥日 o 1 9 司茶吊副 88 运 甲时 8月 多 曹总昌 8 的 云 laued 月别 尉 日 0 司经 o 9 带用 本 g ⑧8 曾 Awwnp d/ d/(+)3

438 The Journal of Finance for variation in 8 that is unrelated to size,the relation between 8 and average return is flat,even when B is the only explanatory variable. B.Fama-MacBeth Regressions Table III shows time-series averages of the slopes from the month-by-month Fama-MacBeth (FM)regressions of the cross-section of stock returns on size, B,and the other variables (leverage,E/P,and book-to-market equity)used to explain average returns.The average slopes provide standard FM tests for determining which explanatory variables on average have non-zero expected premiums during the July 1963 to December 1990 period. Like the average returns in Tables I and II,the regressions in Table III say that size,In(ME),helps explain the cross-section of average stock returns The average slope from the monthly regressions of returns on size alone is -0.15%,with a t-statistic of -2.58.This reliable negative relation persists no matter which other explanatory variables are in the regressions;the average slopes on In(ME)are always close to or more than 2 standard errors from 0.The size effect (smaller stocks have higher average returns)is thus robust in the 1963-1990 returns on NYSE,AMEX,and NASDAQ stocks. In contrast to the consistent explanatory power of size,the FM regressions show that market 8 does not help explain average stock returns for 1963-1990.In a shot straight at the heart of the SLB model,the average slope from the regressions of returns on B alone in Table III is 0.15%per month and only 0.46 standard errors from 0.In the regressions of returns on size and B,size has explanatory power (an average slope -3.41 standard errors from 0),but the average slope for B is negative and only 1.21 standard errors from 0.Lakonishok and Shapiro (1986)get similar results for NYSE stocks for 1962-1981.We can also report that B shows no power to explain average returns (the average slopes are typically less than 1 standard error from 0)in FM regressions that use various combinations of B with size, book-to-market equity,leverage,and E/P. C.Can B Be Saved? What explains the poor results for 8?One possibility is that other explana- tory variables are correlated with true Bs,and this obscures the relation between average returns and measured Bs.But this line of attack cannot explain why B has no power when used alone to explain average returns. Moreover,leverage,book-to-market equity,and E/P do not seem to be good proxies for B.The averages of the monthly cross-sectional correlations be- tween B and the values of these variables for individual stocks are all within 0.15of0. Another hypothesis is that,as predicted by the SLB model,there is a positive relation between B and average return,but the relation is obscured by noise in the B estimates.However,our full-period post-ranking Bs do not seem to be imprecise.Most of the standard errors of the Bs(not shown)are

The Cross-Section of Expected Stock Returns 439 Table III Average Slopes(t-Statistics)from Month-by-Month Regressions of Stock Returns on B,Size,Book-to-Market Equity,Leverage,and E/P: July 1963 to December 1990 Stocks are assigned the post-ranking 8 of the size-B portfolio they are in at the end of June of year t(Table I).BE is the book value of common equity plus balance-sheet deferred taxes,A is total book assets,and E is earnings(income before extraordinary items,plus income-statement deferred taxes,minus preferred dividends).BE,A,and E are for each firm's latest fiscal year ending in calendar year t-1.The accounting ratios are measured using market equity ME in December of year t-1.Firm size In(ME)is measured in June of year t.In the regressions,these values of the explanatory variables for individual stocks are matched with CRSP returns for the months from July of year t to June of year t+1.The gap between the accounting data and the returns ensures that the accounting data are available prior to the returns.If earnings are positive,E(+)/P is the ratio of total earnings to market equity and E/P dummy is 0.If earnings are negative,E(+)/P is 0 and E/P dummy is 1. The average slope is the time-series average of the monthly regression slopes for July 1963 to December 1990,and the t-statistic is the average slope divided by its time-series standard error. On average,there are 2267 stocks in the monthly regressions.To avoid giving extreme observations heavy weight in the regressions,the smallest and largest 0.5%of the observations on E(+)/P,BE/ME,A/ME,and A/BE are set equal to the next largest or smallest values of the ratios (the 0.005 and 0.995 fractiles).This has no effect on inferences. EP In(ME) In(BE/ME) In(A/ME) In(A/BE) Dummy E(+)/P 0.15 (0.46) -0.15 (-2.58) -0.37 -0.17 (-1.21) (-3.41) 0.50 (5.71) 0.50 -0.57 (5.69) (-5.34) 0.57 4.72 (2.28) (4.57) -0.11 0.35 (-1.99) (4.44) -0.11 0.35 -0.50 (-2.06) (4.32) (-4.56) -0.16 0.06 2.99 (-3.06) (0.38) (3.04) -0.13 0.33 -0.14 0.87 (-2.47) (4.46) (-0.90) (1.23) -0.13 0.32 -0.46 -0.08 1.15 (-2.47) (4.28) (-4.45) (-0.56) (1.57)