The Cross-Section of Expected Stock Returns 431 asset-pricing tests lack power to separate size from B effects in average returns. To allow for variation in B that is unrelated to size,we subdivide each size decile into 10 portfolios on the basis of pre-ranking Bs for individual stocks. The pre-ranking Bs are estimated on 24 to 60 monthly returns (as available) in the 5 years before July of year t.We set the B breakpoints for each size decile using only NYSE stocks that satisfy our COMPUSTAT-CRSP data requirements for year t-1.Using NYSE stocks ensures that the 8 break- points are not dominated after 1973 by the many small stocks on NASDAQ. Setting B breakpoints with stocks that satisfy our COMPUSTAT-CRSP data requirements guarantees that there are firms in each of the 100 size-B portfolios. After assigning firms to the size-B portfolios in June,we calculate the equal-weighted monthly returns on the portfolios for the next 12 months, from July to June.In the end,we have post-ranking monthly returns for July 1963 to December 1990 on 100 portfolios formed on size and pre-ranking Bs. We then estimate Bs using the full sample (330 months)of post-ranking returns on each of the 100 portfolios,with the CRSP value-weighted portfolio of NYSE,AMEX,and (after 1972)NASDAQ stocks used as the proxy for the market.We have also estimated Bs using the value-weighted or the equal- weighted portfolio of NYSE stocks as the proxy for the market.These Bs produce inferences on the role of B in average returns like those reported below. We estimate B as the sum of the slopes in the regression of the return on a portfolio on the current and prior month's market return.(An additional lead and lag of the market have little effect on these sum Bs.)The sum Bs are meant to adjust for nonsynchronous trading (Dimson (1979)).Fowler and Rorke (1983)show that sum Bs are biased when the market return is autocorrelated.The 1st-and 2nd-order autocorrelations of the monthly mar. ket returns for July 1963 to December 1990 are 0.06 and-0.05,both about 1 standard error from 0.If the Fowler-Rorke corrections are used,they lead to trivial changes in the Bs.We stick with the simpler sum Bs.Appendix Table AI shows that using sum Bs produces large increases in the Bs of the smallest ME portfolios and small declines in the Bs of the largest ME portfolios Chan and Chen (1988)show that full-period B estimates for portfolios can work well in tests of the SLB model,even if the true Bs of the portfolios vary through time,if the variation in the Bs is proportional, Bt-月,=k.(B,-8), (1) where B;is the true B for portfolio j at time t,B;is the mean of Bit across t, and B is the mean of the B,.The Appendix argues that (1)is a good approximation for the variation through time in the true Bs of portfolios (j) formed on size and B.For diehard B fans,sure to be skeptical of our results on the weak role of B in average stock returns,we can also report that the results stand up to robustness checks that use 5-year pre-ranking Bs,or 5-year post-ranking Bs,instead of the full-period post-ranking Bs

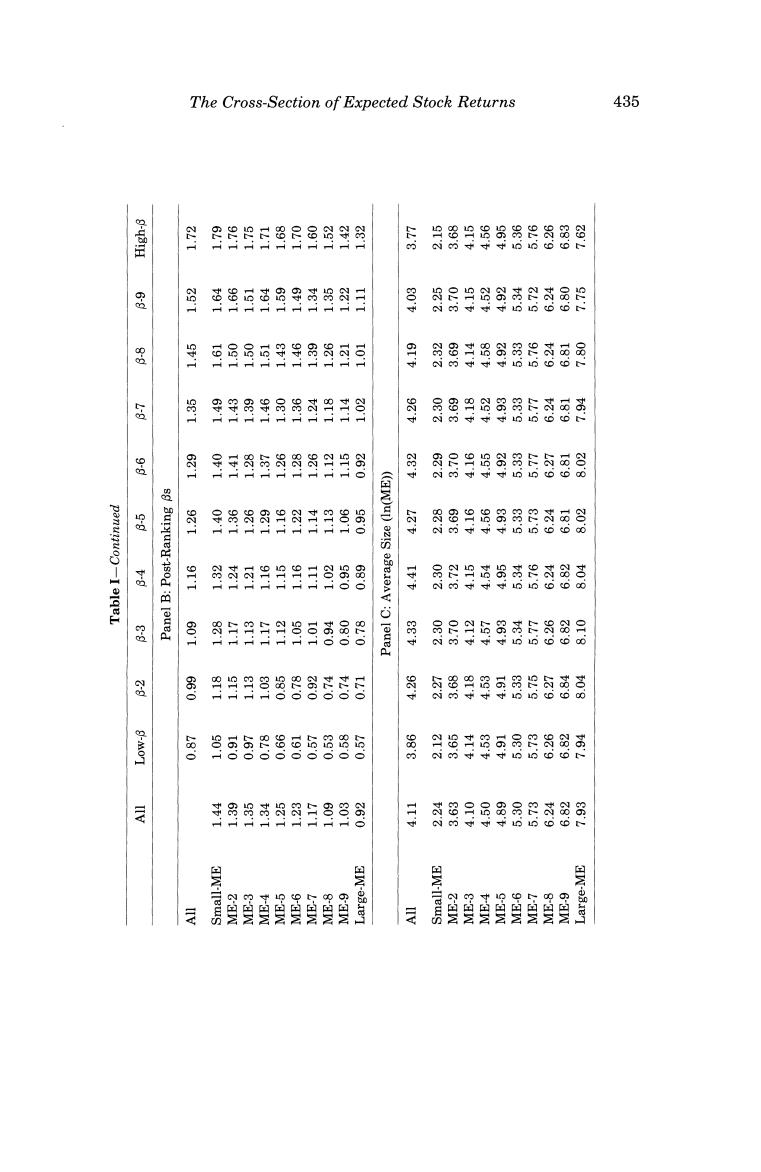
432 The Journal of Finance We allocate the full-period post-ranking 8 of a size-B portfolio to each stock in the portfolio.These are the Bs that will be used in the Fama-MacBeth cross-sectional regressions for individual stocks.We judge that the precision of the full-period post-ranking portfolio Bs,relative to the imprecise 8 esti- mates that would be obtained for individual stocks,more than makes up for the fact that true Bs are not the same for all stocks in a portfolio.And note that assigning full-period portfolio Bs to stocks does not mean that a stock's B is constant.A stock can move across portfolios with year-to-year changes in the stock's size (ME)and in the estimates of its B for the preceding 5 years. B.2.B Estimates Table I shows that forming portfolios on size and pre-ranking Bs,rather than on size alone,magnifies the range of full-period post-ranking Bs.Sorted on size alone,the post-ranking Bs range from 1.44 for the smallest ME portfolio to 0.92 for the largest.This spread of Bs across the 10 size deciles is smaller than the spread of post-ranking Bs produced by the B sort of any size decile.For example,the post-ranking Bs for the 10 portfolios in the smallest size decile range from 1.05 to 1.79.Across all 100 size-B portfolios,the post-ranking Bs range from 0.53 to 1.79,a spread 2.4 times the spread,0.52, obtained with size portfolios alone. Two other facts about the Bs are important.First,in each size decile the post-ranking Bs closely reproduce the ordering of the pre-ranking Bs.We take this to be evidence that the pre-ranking B sort captures the ordering of true post-ranking Bs.(The appendix gives more evidence on this important issue.)Second,the B sort is not a refined size sort.In any size decile,the average values of In(ME)are similar across the B-sorted portfolios.Thus the pre-ranking B sort achieves its goal.It produces strong variation in post- ranking Bs that is unrelated to size.This is important in allowing our tests to distinguish between B and size effects in average returns. II.B and Size The Sharpe-Lintner-Black(SLB)model plays an important role in the way academics and practitioners think about risk and the relation between risk and expected return.We show next that when common stock portfolios are formed on size alone,there seems to be evidence for the model's central prediction:average return is positively related to B.The Bs of size portfolios are,however,almost perfectly correlated with size,so tests on size portfolios are unable to disentangle B and size effects in average returns.Allowing for variation in B that is unrelated to size breaks the logjam,but at the expense of B.Thus,when we subdivide size portfolios on the basis of pre-ranking Bs, we find a strong relation between average return and size,but no relation between average return and B
The Cross-Section of Expected Stock Returns 433 A.Informal Tests Table II shows post-ranking average returns for July 1963 to December 1990 for portfolios formed from one-dimensional sorts of stocks on size or B. The portfolios are formed at the end of June each year and their equal- weighted returns are calculated for the next 12 months.We use returns for July to June to match the returns in later tests that use the accounting data. When we sort on just size or 5-year pre-ranking Bs,we form 12 portfolios. The middle 8 cover deciles of size or B.The 4 extreme portfolios(1A,1B,10A, and 10B)split the bottom and top deciles in half. Table II shows that when portfolios are formed on size alone,we observe the familiar strong negative relation between size and average return(Banz (1981)),and a strong positive relation between average return and B.Aver- age returns fall from 1.64%per month for the smallest ME portfolio to 0.90% for the largest.Post-ranking Bs also decline across the 12 size portfolios,from 1.44 for portfolio 1A to 0.90 for portfolio 10B.Thus,a simple size sort seems to support the SLB prediction of a positive relation between B and average return.But the evidence is muddied by the tight relation between size and the Bs of size portfolios. The portfolios formed on the basis of the ranked market Bs of stocks in Table II produce a wider range of Bs (from 0.81 for portfolio 1A to 1.73 for 10B)than the portfolios formed on size.Unlike the size portfolios,the B-sorted portfolios do not support the SLB model.There is little spread in average returns across the 8 portfolios,and there is no obvious relation between B and average returns.For example,although the two extreme portfolios,1A and 10B,have much different Bs,they have nearly identical average returns (1.20%and 1.18%per month).These results for 1963-1990 confirm Reinganum's(1981)evidence that for B-sorted portfolios,there is no relation between average return and 8 during the 1964-1979 period. The 100 portfolios formed on size and then pre-ranking B in Table I clarify the contradictory evidence on the relation between B and average return produced by portfolios formed on size or 8 alone.Specifically,the two-pass sort gives a clearer picture of the separate roles of size and B in average returns.Contrary to the central prediction of the SLB model,the second-pass B sort produces little variation in average returns.Although the post-ranking Bs in Table I increase strongly in each size decile,average returns are flat or show a slight tendency to decline.In contrast,within the columns of the average return and B matrices of Table I,average returns and Bs decrease with increasing size. The two-pass sort on size and B in Table I says that variation in B that is tied to size is positively related to average return,but variation in B unrelated to size is not compensated in the average returns of 1963-1990. The proper inference seems to be that there is a relation between size and average return,but controlling for size,there is no relation between B and average return.The regressions that follow confirm this conclusion,and they produce another that is stronger.The regressions show that when one allows

434 The Finance , 女真1 日 e 多 0 o 器 6.8 921 22.1 芦 员 門 三 尉 8 真0L 85.1 豆 8 2 高 女01 日 品 82.1 应 I alqeL 066I aqwaad01 896I Amp 0y3 1oaw 1ey1 sy0s OVaSVN pue 'XaNV 'SAN lIV 'dSHO uo syoos SAN IIe Suisn (0661-896I =1)1 BoK Jo aunp Aly uow jo seak g o1 Z yM payeunsa'syoons IenpLarpur jo sg SuryueI-aad Sursn sorronod g OI our paptarpqns sr amoap eep LVISndWOO'dSHo 9y 1aaw qe1 syoons SAN A[uo asn aM '1 eoK jo aunf ur Bu!pua (alqelleAe se)sumngax uayi are so!ojod 00I 3urmnsal ay3 uo suingaI Alyquou pany3ram-Tenba auL'squrodyeaq g ayl ys!lqease o squawalbai auL 'o!opod yoea iog suangaI Burxuet-asod Jo aldues (066T aqwaoa(I o 896I Amnp)IInj ay3 asn sg Surxue-sod auL 足 25.1 02.1 员 高 5.1 I9'I 8 照 89.1 8 'I eax jo aunp on 1 eaf Jo Amnp oJ panemno[eo 'sIellop Jo suorllu u!payeurwouap HI yIM Ieaf 8 厨8 pue II uaamiaq st salroap azts L 1saBaeI ay g-MOI 女2.1 8 6 8 0 专 201 8 的图 爱 L-aW 8aW 6
The Cross-Section of Expected Stock Returns 435 思9日8e 品的斜 9器9治品贵思贵贸 6时防寸 to t 爱 落回 9 品的 罩 389 料贰品 oic时中iun606 照 451 器闲时 101 斜8寸品的积青西品 11 0 O 胡 9 员号 801 出 62.1 于的品 图格斜 群 周 ci co 得好每贸后包石器 盟 品 P01 9 罩 尊 8 y 导 的朗 2高司 器 爱 手 品 0n0⊙ 60.1 859片 号 8 820 解 品8 6的房长88 oi co 的0o0 o 66.0 99的8 器 9 路分的9黄 0 0 s 苦 1.0 od 8-MOI 马 阳 三 250 月棉中超耳 云 的贵盼 三 贰超马 用品 尉8 員星 6-HW 3W-08e1 灵 W &W 6I W-a8eI