Multifactor Explanations of Asset Pricing Anomalies STOR Eugene F.Fama;Kenneth R.FrencH The Journal of Finance,Volume 51,Issue 1 (Mar.,1996),55-84. Stable URL: http://links.istor.org/sici?sici=0022-1082%28199603%2951%3A1%3C55%3AMEOAPA%3E2.0.CO%3B2-B Your use of the JSTOR archive indicates your acceptance of JSTOR's Terms and Conditions of Use,available at http://www.jstor.org/about/terms.html.JSTOR's Terms and Conditions of Use provides,in part,that unless you have obtained prior permission,you may not download an entire issue of a journal or multiple copies of articles,and you may use content in the JSTOR archive only for your personal,non-commercial use. Each copy of any part of a JSTOR transmission must contain the same copyright notice that appears on the screen or printed page of such transmission. The Journal of Finance is published by American Finance Association.Please contact the publisher for further permissions regarding the use of this work.Publisher contact information may be obtained at http://www.jstor.org/journals/afina.html. The Journal of Finance 1996 American Finance Association JSTOR and the JSTOR logo are trademarks of JSTOR,and are Registered in the U.S.Patent and Trademark Office. For more information on JSTOR contact jstor-info@umich.edu. ©2003 JSTOR http://www.jstor.org/ Mon Feb1709:55:262003
THE JOURNAL OF FINANCE.VOL.LI,NO.1.MARCH 1996 Multifactor Explanations of Asset Pricing Anomalies EUGENE F.FAMA and KENNETH R.FRENCH* ABSTRACT Previous work shows that average returns on common stocks are related to firm characteristics like size,earnings/price,cash flow/price,book-to-market equity,past sales growth,long-term past return,and short-term past return.Because these patterns in average returns apparently are not explained by the CAPM,they are called anomalies.We find that,except for the continuation of short-term returns,the anomalies largely disappear in a three-factor model.Our results are consistent with rational ICAPM or APT asset pricing,but we also consider irrational pricing and data problems as possible explanations. RESEARCHERS HAVE IDENTIFIED MANY patterns in average stock returns.For ex- ample,DeBondt and Thaler(1985)find a reversal in long-term returns;stocks with low long-term past returns tend to have higher future returns.In con- trast,Jegadeesh and Titman (1993)find that short-term returns tend to continue;stocks with higher returns in the previous twelve months tend to have higher future returns.Others show that a firm's average stock return is related to its size (ME,stock price times number of shares),book-to-market- equity (BE/ME,the ratio of the book value of common equity to its market value),earnings/price(E/P),cash flow/price(C/P),and past sales growth.(Banz (1981),Basu(1983),Rosenberg,Reid,and Lanstein(1985),and Lakonishok, Shleifer and Vishny (1994).)Because these patterns in average stock returns are not explained by the capital asset pricing model(CAPM)of Sharpe(1964) and Lintner(1965),they are typically called anomalies. This paper argues that many of the CAPM average-return anomalies are related,and they are captured by the three-factor model in Fama and French (FF 1993).The model says that the expected return on a portfolio in excess of the risk-free rate [E(R)-Rel is explained by the sensitivity of its return to three factors:(i)the excess return on a broad market portfolio(R-R;(ii) the difference between the return on a portfolio of small stocks and the return on a portfolio of large stocks (SMB,small minus big);and (iii)the difference between the return on a portfolio of high-book-to-market stocks and the return on a portfolio of low-book-to-market stocks (HML,high minus low).Specifi- cally,the expected excess return on portfolio iis, E(R)-R=bE(RM)-R]+sE(SMB)+hE(HML), (1) Fama is from the Graduate School of Business,University of Chicago,and French is from the Yale School of Management,The comments of Clifford Asness,John Cochrane,Josef Lakonishok, G.William Schwert,and Rene Stulz are gratefully acknowledged. 55
56 The Journal of Finance where E(Ry)-R E(SMB),and E(HML)are expected premiums,and the factor sensitivities or loadings,bi,si,and hi,are the slopes in the time-series regression, Ri-R=ai+b(RM-R+s:SMB+hHML+8i. (2) Fama and French (1995)show that book-to-market equity and slopes on HML proxy for relative distress.Weak firms with persistently low earnings tend to have high BE/ME and positive slopes on HML;strong firms with persistently high earnings have low BE/ME and negative slopes on HML. Using HML to explain returns is thus in line with the evidence of Chan and Chen(1991)that there is covariation in returns related to relative distress that is not captured by the market return and is compensated in average returns. Similarly,using SMB to explain returns is in line with the evidence of Huber- man and Kandel(1987)that there is covariation in the returns on small stocks that is not captured by the market return and is compensated in average returns. The three-factor model in (1)seems to capture much of the cross-sectional variation in average stock returns.FF(1993)show that the model is a good description of returns on portfolios formed on size and BE/ME.FF(1994)use the model to explain industry returns.Here we show that the three-factor model captures the returns to portfolios formed on E/P,C/P,and sales growth In a nutshell,low E/P,low C/P,and high sales growth are typical of strong firms that have negative slopes on HML.Since the average HML return is strongly positive(about 6 percent per year),these negative loadings,which are similar to the HML slopes for low-BE/ME stocks,imply lower expected returns in (1).Conversely,like high-BE/ME stocks,stocks with high E/P,high C/P,or low sales growth tend to load positively on HML (they are relatively dis- tressed),and they have higher average returns.The three-factor model also captures the reversal of long-term returns documented by DeBondt and Thaler (1985).Stocks with low long-term past returns (losers)tend to have positive SMB and HML slopes (they are smaller and relatively distressed)and higher future average returns.Conversely,long-term winners tend to be strong stocks that have negative slopes on HML and low future returns. Equation (1),however,cannot explain the continuation of short-term re- turns documented by Jegadeesh and Titman (1993).Like long-term losers, stocks that have low short-term past returns tend to load positively on HML; like long-term winners,short-term past winners load negatively on HML.As it does for long-term returns,this pattern in the HML slopes predicts reversal rather than continuation for future returns.The continuation of short-term returns is thus left unexplained by our model. At a minimum,the available evidence suggests that the three-factor model in (1)and(2),with intercepts in(2)equal to 0.0,is a parsimonious description of returns and average returns.The model captures much of the variation in the cross-section of average stock returns,and it absorbs most of the anomalies that have plagued the CAPM.More aggressively,we argue in FF(1993,1994
Multifactor Explanations of Asset Pricing Anomalies 57 1995)that the empirical successes of(1)suggest that it is an equilibrium pricing model,a three-factor version of Merton's(1973)intertemporal CAPM (ICAPM)or Ross's(1976)arbitrage pricing theory (APT).In this view,SMB and HML mimic combinations of two underlying risk factors or state variables of special hedging concern to investors. Our aggressive interpretation of tests of(1)has produced reasonable skep- ticism,much of it centered on the premium for distress (the average HML return).Kothari,Shanken,and Sloan(1995)argue that a substantial part of the premium is due to survivor bias;the data source for book equity (COM- PUSTAT)contains a disproportionate number of high-BE/ME firms that sur- vive distress,so the average return for high-BE/ME firms is overstated.An- other view is that the distress premium is just data snooping;researchers tend to search for and fixate on variables that are related to average return,but only in the sample used to identify them(Black(1993),MacKinlay (1995)).A third view is that the distress premium is real but irrational,the result of investor over-reaction that leads to underpricing of distressed stocks and overpricing of growth stocks(Lakonishok,Shleifer,and Vishny(1994),Haugen (1995). Section VI discusses the competing stories for the successes of the three- factor model.First,however,Sections I to V present the evidence that the model captures most of the average-return anomalies of the CAPM. I.Tests on the 25 FF Size-BE/ME Portfolios To set the stage,Table I shows the average excess returns on the 25 Fama- French (1993)size-BE/ME portfolios of value-weighted NYSE,AMEX,and NASD stocks.The table shows that small stocks tend to have higher returns than big stocks and high-book-to-market stocks have higher returns than low-BE/ME stocks. Table I also reports estimates of the three-factor time-series regression(2). If the three-factor model(1)describes expected returns,the regression inter- cepts should be close to 0.0.The estimated intercepts say that the model leaves a large negative unexplained return for the portfolio of stocks in the smallest size and lowest BE/ME quintiles,and a large positive unexplained return for the portfolio of stocks in the largest size and lowest BE/ME quintiles.Other- wise the intercepts are close to 0.0. The F-test of Gibbons,Ross,and Shanken(GRS 1989)rejects the hypothesis that (1)explains the average returns on the 25 size-BE/ME portfolios at the 0.004 level.This rejection of the three-factor model is testimony to the explan- atory power of the regressions.The average of the 25 regression R2 is 0.93,so small intercepts are distinguishable from zero.The model does capture most of the variation in the average returns on the portfolios,as witnessed by the small average absolute intercept,0.093 percent (about nine basis points)per month.We show next that the model does an even better job on most of the other sets of portfolios we consider
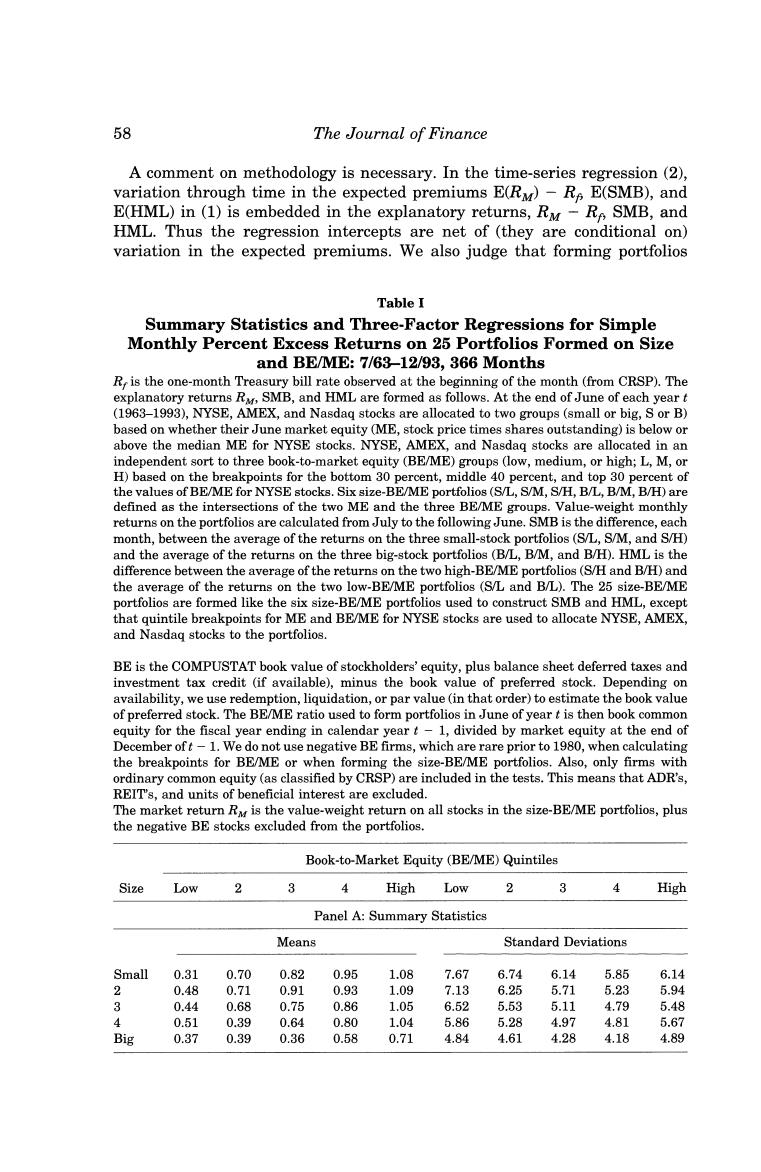
58 The Journal of Finance A comment on methodology is necessary.In the time-series regression(2), variation through time in the expected premiums E(RM)-Re E(SMB),and E(HML)in(1)is embedded in the explanatory returns,Ry-Re SMB,and HML.Thus the regression intercepts are net of (they are conditional on) variation in the expected premiums.We also judge that forming portfolios Table I Summary Statistics and Three-Factor Regressions for Simple Monthly Percent Excess Returns on 25 Portfolios Formed on Size and BE/ME:7/63-12/93,366 Months R,is the one-month Treasury bill rate observed at the beginning of the month (from CRSP).The explanatory returns R,SMB,and HML are formed as follows.At the end of June of each yeart (1963-1993),NYSE,AMEX,and Nasdaq stocks are allocated to two groups(small or big,S or B) based on whether their June market equity (ME,stock price times shares outstanding)is below or above the median ME for NYSE stocks.NYSE,AMEX,and Nasdag stocks are allocated in an independent sort to three book-to-market equity (BE/ME)groups (low,medium,or high;L,M,or H)based on the breakpoints for the bottom 30 percent,middle 40 percent,and top 30 percent of the values of BE/ME for NYSE stocks.Six size-BE/ME portfolios(S/L,S/M,S/H,B/L,B/M,B/H)are defined as the intersections of the two ME and the three BE/ME groups.Value-weight monthly returns on the portfolios are calculated from July to the following June.SMB is the difference,each month,between the average of the returns on the three small-stock portfolios(S/L.S/M,and S/H) and the average of the returns on the three big-stock portfolios(B/L,B/M,and B/H).HML is the difference between the average of the returns on the two high-BE/ME portfolios (S/H and B/H)and the average of the returns on the two low-BE/ME portfolios (S/L and B/L).The 25 size-BE/ME portfolios are formed like the six size-BE/ME portfolios used to construct SMB and HML,except that quintile breakpoints for ME and BE/ME for NYSE stocks are used to allocate NYSE,AMEX, and Nasdag stocks to the portfolios. BE is the COMPUSTAT book value of stockholders'equity,plus balance sheet deferred taxes and investment tax credit (if available),minus the book value of preferred stock.Depending on availability,we use redemption,liquidation,or par value(in that order)to estimate the book value of preferred stock.The BE/ME ratio used to form portfolios in June of year t is then book common equity for the fiscal year ending in calendar yeart-1,divided by market equity at the end of December oft-1.We do not use negative BE firms,which are rare prior to 1980,when calculating the breakpoints for BE/ME or when forming the size-BE/ME portfolios.Also,only firms with ordinary common equity (as classified by CRSP)are included in the tests.This means that ADR's, REIT's,and units of beneficial interest are excluded. The market return R is the value-weight return on all stocks in the size-BE/ME portfolios,plus the negative BE stocks excluded from the portfolios. Book-to-Market Equity (BE/ME)Quintiles Size Low 2 4 High Low 2 3 High Panel A:Summary Statistics Means Standard Deviations Small 0.31 0.70 0.82 0.95 1.08 7.67 6.74 6.14 5.85 6.14 2 0.48 0.71 0.91 0.93 1.09 7.13 6.25 5.71 5.23 5.94 3 0.44 0.68 0.75 0.86 1.05 6.52 5.53 5.11 4.79 5.48 4 0.51 0.39 0.64 0.80 1.04 5.86 5.28 4.97 4.81 5.67 Big 0.37 0.39 0.36 0.58 0.71 4.84 4.61 4.28 4.18 4.89