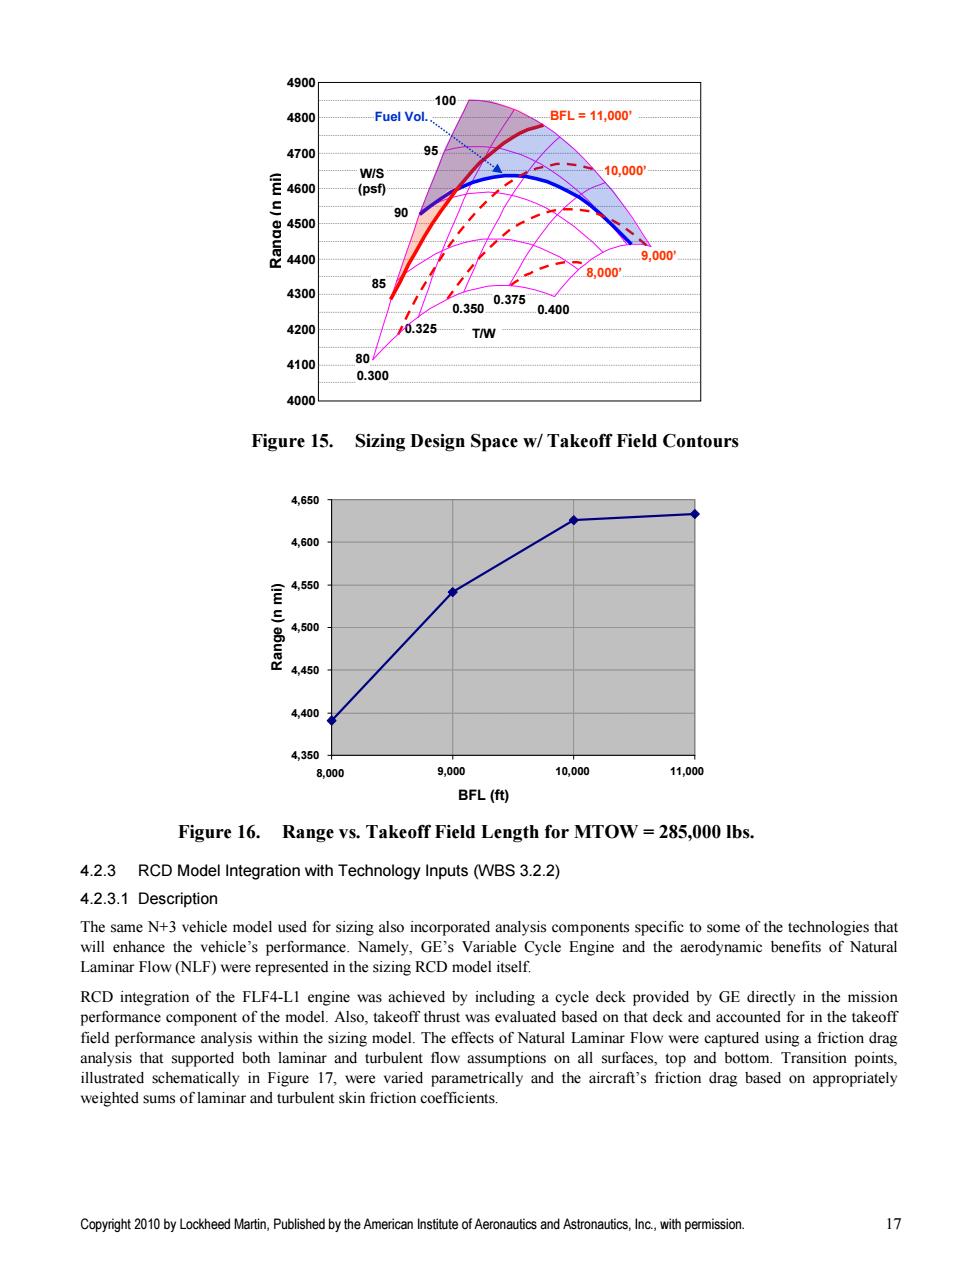
The consequence of this improvement in sonic boom signature was a reduction in L/D from 10.1 to 8.0(at beginning of cruise). This decline incurred because the initial shape did not meet the constraints required for sonic boom.The aero/boom shape optimization process yielded the five Pareto points in Figure 13,which represent the trade space between sonic boom and L/D. However,it is believed that a much less severe trade-off in L/D can be achieved for the same reductions in sonic boom with design tool improvements,more vehicle parameters used in optimization and more time spent assessing and re-running optimization. This aero/boom shape optimization yielded two important results regarding the ability of the N+3 vehicle to meet its goals. First,it verified that the aircraft's lifting surfaces can be shaped to meet the 70-PLdB boom target.Second,it quantified the aerodynamic cost of doing so in terms of L/D.The latter result,shown to be a 21%reduction (from 10.1 to 8.0).will also be offset by aerodynamic technologies such as Natural Laminar Flow (to be described in Section 4.2.4.2)to enable a low-boom configuration to continue to meet N+3 range goals of over 4000 n mi. 4.2.2.2 Sizing and Mission Performance LM's Rapid Conceptual Design(RCD)process was also used to size the as-drawn configuration to achieve maximum range subject to fuel volume and takeoff performance constraints.The integrated,multidisciplinary sizing model included multiple aerodynamic components (profile,induced,and wave drag),a parametric weights buildup,and mission performance and balanced field length(BFL)analyses.In addition to sizing,it facilitated assessments of N+3 technology benefits at the system (vehicle)level. The sensitivity of the sized N+3 vehicle's range to changes in maximum takeoff weight(MTOW)is illustrated in Figure 14. The blue line on the figure illustrates the nearly linear relationship between MTOW and range.Each 1000 Ibs.of additional weight yields approximately 11.2 nautical miles of added range;this translates to 89.3 Ibs per mile.The red line and right-hand axis on Figure 14 denote passenger-miles flown per Ib.fuel on each mission,an efficiency metric which decreases with additional weight.The configuration was re-sized in accordance with the fuel volume and takeoff field constraints depicted in Figure 15 to produce the results in Figure 14.Extrapolating the red(efficiency)line on the plot suggests that ranges up to 5000 n mi,which would correspond to a MTOW of approximately 320,000 Ibs.,are possible while meeting or exceeding N+3's minimum efficiency goal of 3.5 pax*nmi per Ib.fuel. 5000 4.2 4900 ◆Range 4.1 -Efficiency 4800 4.0 4700 3.9 E 4600 3.8 复 4500 31 4400 3.6 4300 3.5 260 270 280 290 300 310 MTOW(x1000 Ibs) Figure 14.Range Efficiency vs.MTOW Reducing the maximum allowable takeoff field,which was originally 11,000'during sizing,has no impact until the requirement falls below the sized configuration's takeoff field length of 9.970'.As the field performance gets more restrictive, it requires increasing the thrust-to-weight ratio and decreasing wing loading,as shown in Figure 21.Both of these lead to inefficient cruise,decreasing the achievable mission range as illustrated in Figure 16.This analysis was performed with a constant MTOW of 285,000 Ibs. Copyright 2010 by Lockheed Martin,Published by the American Institute of Aeronautics and Astronautics,Inc.,with permission. 16
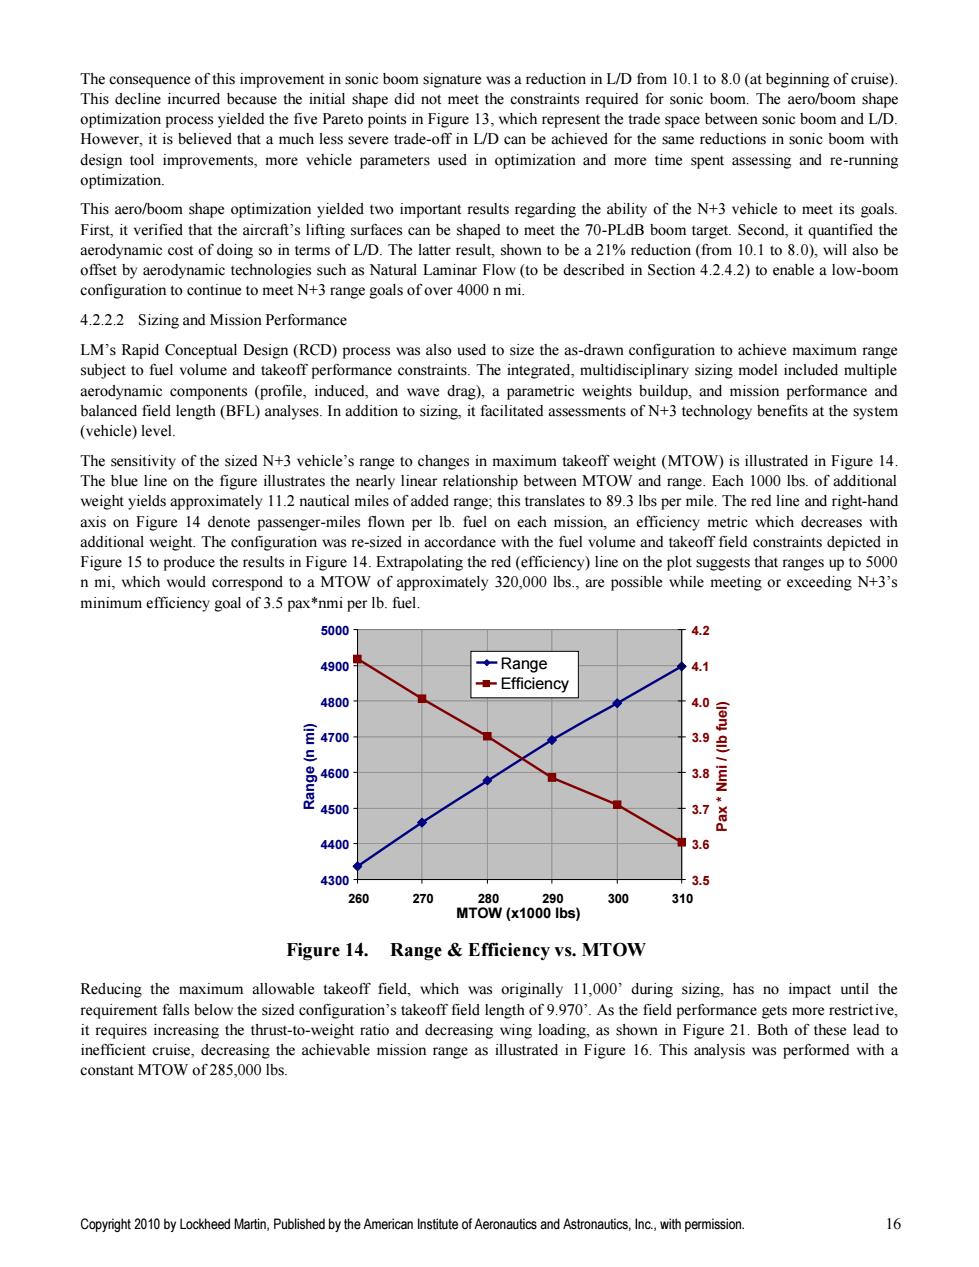
Copyright 2010 by Lockheed Martin, Published by the American Institute of Aeronautics and Astronautics, Inc., with permission. 16 The consequence of this improvement in sonic boom signature was a reduction in L/D from 10.1 to 8.0 (at beginning of cruise). This decline incurred because the initial shape did not meet the constraints required for sonic boom. The aero/boom shape optimization process yielded the five Pareto points in Figure 13, which represent the trade space between sonic boom and L/D. However, it is believed that a much less severe trade-off in L/D can be achieved for the same reductions in sonic boom with design tool improvements, more vehicle parameters used in optimization and more time spent assessing and re-running optimization. This aero/boom shape optimization yielded two important results regarding the ability of the N+3 vehicle to meet its goals. First, it verified that the aircraft‘s lifting surfaces can be shaped to meet the 70-PLdB boom target. Second, it quantified the aerodynamic cost of doing so in terms of L/D. The latter result, shown to be a 21% reduction (from 10.1 to 8.0), will also be offset by aerodynamic technologies such as Natural Laminar Flow (to be described in Section 4.2.4.2) to enable a low-boom configuration to continue to meet N+3 range goals of over 4000 n mi. 4.2.2.2 Sizing and Mission Performance LM‘s Rapid Conceptual Design (RCD) process was also used to size the as-drawn configuration to achieve maximum range subject to fuel volume and takeoff performance constraints. The integrated, multidisciplinary sizing model included multiple aerodynamic components (profile, induced, and wave drag), a parametric weights buildup, and mission performance and balanced field length (BFL) analyses. In addition to sizing, it facilitated assessments of N+3 technology benefits at the system (vehicle) level. The sensitivity of the sized N+3 vehicle‘s range to changes in maximum takeoff weight (MTOW) is illustrated in Figure 14. The blue line on the figure illustrates the nearly linear relationship between MTOW and range. Each 1000 lbs. of additional weight yields approximately 11.2 nautical miles of added range; this translates to 89.3 lbs per mile. The red line and right-hand axis on Figure 14 denote passenger-miles flown per lb. fuel on each mission, an efficiency metric which decreases with additional weight. The configuration was re-sized in accordance with the fuel volume and takeoff field constraints depicted in Figure 15 to produce the results in Figure 14. Extrapolating the red (efficiency) line on the plot suggests that ranges up to 5000 n mi, which would correspond to a MTOW of approximately 320,000 lbs., are possible while meeting or exceeding N+3‘s minimum efficiency goal of 3.5 pax*nmi per lb. fuel. Figure 14. Range & Efficiency vs. MTOW Reducing the maximum allowable takeoff field, which was originally 11,000‘ during sizing, has no impact until the requirement falls below the sized configuration‘s takeoff field length of 9.970‘. As the field performance gets more restrictive, it requires increasing the thrust-to-weight ratio and decreasing wing loading, as shown in Figure 21. Both of these lead to inefficient cruise, decreasing the achievable mission range as illustrated in Figure 16. This analysis was performed with a constant MTOW of 285,000 lbs. 4300 4400 4500 4600 4700 4800 4900 5000 260 270 280 290 300 310 MTOW (x1000 lbs) Range (n mi) 3.5 3.6 3.7 3.8 3.9 4.0 4.1 4.2 Pax * Nmi / (lb fuel) Range Efficiency
4900 100 4800 Fuel Vol. BFL=11,000 4700 95 WIS 10.000 4600 (psf) 90 4500 4400 9.000 8.000 85 4300 0.375 0.350 0.400 4200 0.325 T/W 4100 80 0.300 4000 Figure 15.Sizing Design Space w/Takeoff Field Contours 4,650 4,600 是0 4,500 4,450 4,400 4,350+ 8,000 9,000 10,000 11,000 BFL(ft) Figure 16.Range vs.Takeoff Field Length for MTOW =285,000 Ibs. 4.2.3 RCD Model Integration with Technology Inputs (WBS 3.2.2) 4.2.3.1 Description The same N+3 vehicle model used for sizing also incorporated analysis components specific to some of the technologies that will enhance the vehicle's performance.Namely,GE's Variable Cycle Engine and the aerodynamic benefits of Natural Laminar Flow(NLF)were represented in the sizing RCD model itself. RCD integration of the FLF4-LI engine was achieved by including a cycle deck provided by GE directly in the mission performance component of the model.Also,takeoff thrust was evaluated based on that deck and accounted for in the takeoff field performance analysis within the sizing model.The effects of Natural Laminar Flow were captured using a friction drag analysis that supported both laminar and turbulent flow assumptions on all surfaces,top and bottom.Transition points, illustrated schematically in Figure 17,were varied parametrically and the aircraft's friction drag based on appropriately weighted sums of laminar and turbulent skin friction coefficients. Copyright 2010 by Lockheed Martin,Published by the American Institute of Aeronautics and Astronautics,Inc.,with permission. 17
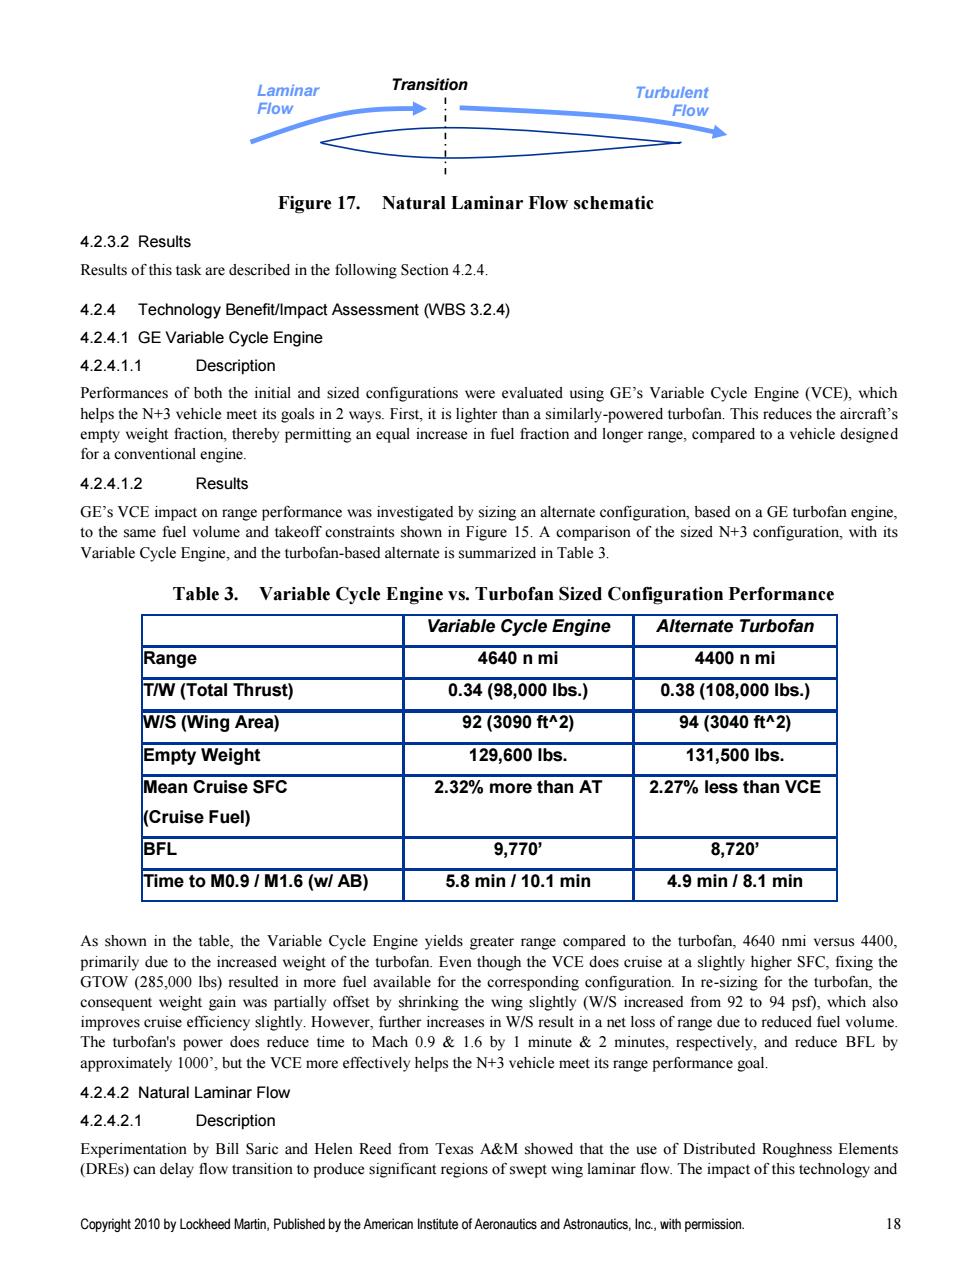
Copyright 2010 by Lockheed Martin, Published by the American Institute of Aeronautics and Astronautics, Inc., with permission. 17 Figure 15. Sizing Design Space w/ Takeoff Field Contours Figure 16. Range vs. Takeoff Field Length for MTOW = 285,000 lbs. 4.2.3 RCD Model Integration with Technology Inputs (WBS 3.2.2) 4.2.3.1 Description The same N+3 vehicle model used for sizing also incorporated analysis components specific to some of the technologies that will enhance the vehicle‘s performance. Namely, GE‘s Variable Cycle Engine and the aerodynamic benefits of Natural Laminar Flow (NLF) were represented in the sizing RCD model itself. RCD integration of the FLF4-L1 engine was achieved by including a cycle deck provided by GE directly in the mission performance component of the model. Also, takeoff thrust was evaluated based on that deck and accounted for in the takeoff field performance analysis within the sizing model. The effects of Natural Laminar Flow were captured using a friction drag analysis that supported both laminar and turbulent flow assumptions on all surfaces, top and bottom. Transition points, illustrated schematically in Figure 17, were varied parametrically and the aircraft‘s friction drag based on appropriately weighted sums of laminar and turbulent skin friction coefficients. 4,350 4,400 4,450 4,500 4,550 4,600 4,650 8,000 9,000 10,000 11,000 BFL (ft) Range (n mi) Range (n mi) 4000 4100 4200 4300 4400 4500 4600 4700 4800 4900 100 95 90 85 80 0.300 0.325 0.350 0.375 0.400 W/S (psf) T/W BFL = 11,000’ 10,000’ 9,000’ 8,000’ Fuel Vol
Laminar Transition Turbulent 1 Flow Flow Figure 17.Natural Laminar Flow schematic 4.2.3.2 Results Results of this task are described in the following Section 4.2.4. 4.2.4 Technology Benefit/Impact Assessment (WBS 3.2.4) 4.2.4.1 GE Variable Cycle Engine 4.2.4.1.1 Description Performances of both the initial and sized configurations were evaluated using GE's Variable Cycle Engine(VCE),which helps the N+3 vehicle meet its goals in 2 ways.First,it is lighter than a similarly-powered turbofan.This reduces the aircraft's empty weight fraction,thereby permitting an equal increase in fuel fraction and longer range,compared to a vehicle designed for a conventional engine. 4.2.4.1.2 Results GE's VCE impact on range performance was investigated by sizing an alternate configuration,based on a GE turbofan engine, to the same fuel volume and takeoff constraints shown in Figure 15.A comparison of the sized N+3 configuration,with its Variable Cycle Engine,and the turbofan-based alternate is summarized in Table 3. Table 3.Variable Cycle Engine vs.Turbofan Sized Configuration Performance Variable Cycle Engine Alternate Turbofan Range 4640 n mi 4400 n mi T/W(Total Thrust) 0.34(98,0001bs.) 0.38(108,0001bs.) W/S(Wing Area) 92(3090ft2) 94(3040ft2) Empty Weight 129,600Ibs. 131,500Ibs. Mean Cruise SFC 2.32%more than AT 2.27%less than VCE (Cruise Fuel) BFL 9,770 8,720 Time to M0.9/M1.6(w/AB) 5.8 min /10.1 min 4.9 min/8.1 min As shown in the table,the Variable Cycle Engine yields greater range compared to the turbofan,4640 nmi versus 4400, primarily due to the increased weight of the turbofan.Even though the VCE does cruise at a slightly higher SFC,fixing the GTOW(285,000 Ibs)resulted in more fuel available for the corresponding configuration.In re-sizing for the turbofan,the consequent weight gain was partially offset by shrinking the wing slightly (W/S increased from 92 to 94 psf),which also improves cruise efficiency slightly.However,further increases in W/S result in a net loss of range due to reduced fuel volume. The turbofan's power does reduce time to Mach 0.9&1.6 by I minute &2 minutes,respectively,and reduce BFL by approximately 1000,but the VCE more effectively helps the N+3 vehicle meet its range performance goal. 4.2.4.2 Natural Laminar Flow 4.2.4.2.1 Description Experimentation by Bill Saric and Helen Reed from Texas A&M showed that the use of Distributed Roughness Elements (DREs)can delay flow transition to produce significant regions of swept wing laminar flow.The impact of this technology and Copyright 2010 by Lockheed Martin,Published by the American Institute of Aeronautics and Astronautics,Inc.,with permission. 18
Copyright 2010 by Lockheed Martin, Published by the American Institute of Aeronautics and Astronautics, Inc., with permission. 18 Figure 17. Natural Laminar Flow schematic 4.2.3.2 Results Results of this task are described in the following Section 4.2.4. 4.2.4 Technology Benefit/Impact Assessment (WBS 3.2.4) 4.2.4.1 GE Variable Cycle Engine 4.2.4.1.1 Description Performances of both the initial and sized configurations were evaluated using GE‘s Variable Cycle Engine (VCE), which helps the N+3 vehicle meet its goals in 2 ways. First, it is lighter than a similarly-powered turbofan. This reduces the aircraft‘s empty weight fraction, thereby permitting an equal increase in fuel fraction and longer range, compared to a vehicle designed for a conventional engine. 4.2.4.1.2 Results GE‘s VCE impact on range performance was investigated by sizing an alternate configuration, based on a GE turbofan engine, to the same fuel volume and takeoff constraints shown in Figure 15. A comparison of the sized N+3 configuration, with its Variable Cycle Engine, and the turbofan-based alternate is summarized in Table 3. Table 3. Variable Cycle Engine vs. Turbofan Sized Configuration Performance Variable Cycle Engine Alternate Turbofan Range 4640 n mi 4400 n mi T/W (Total Thrust) 0.34 (98,000 lbs.) 0.38 (108,000 lbs.) W/S (Wing Area) 92 (3090 ft^2) 94 (3040 ft^2) Empty Weight 129,600 lbs. 131,500 lbs. Mean Cruise SFC (Cruise Fuel) 2.32% more than AT 2.27% less than VCE BFL 9,770’ 8,720’ Time to M0.9 / M1.6 (w/ AB) 5.8 min / 10.1 min 4.9 min / 8.1 min As shown in the table, the Variable Cycle Engine yields greater range compared to the turbofan, 4640 nmi versus 4400, primarily due to the increased weight of the turbofan. Even though the VCE does cruise at a slightly higher SFC, fixing the GTOW (285,000 lbs) resulted in more fuel available for the corresponding configuration. In re-sizing for the turbofan, the consequent weight gain was partially offset by shrinking the wing slightly (W/S increased from 92 to 94 psf), which also improves cruise efficiency slightly. However, further increases in W/S result in a net loss of range due to reduced fuel volume. The turbofan's power does reduce time to Mach 0.9 & 1.6 by 1 minute & 2 minutes, respectively, and reduce BFL by approximately 1000‘, but the VCE more effectively helps the N+3 vehicle meet its range performance goal. 4.2.4.2 Natural Laminar Flow 4.2.4.2.1 Description Experimentation by Bill Saric and Helen Reed from Texas A&M showed that the use of Distributed Roughness Elements (DREs) can delay flow transition to produce significant regions of swept wing laminar flow. The impact of this technology and Transition Pt. Laminar Flow Turbulent Flow
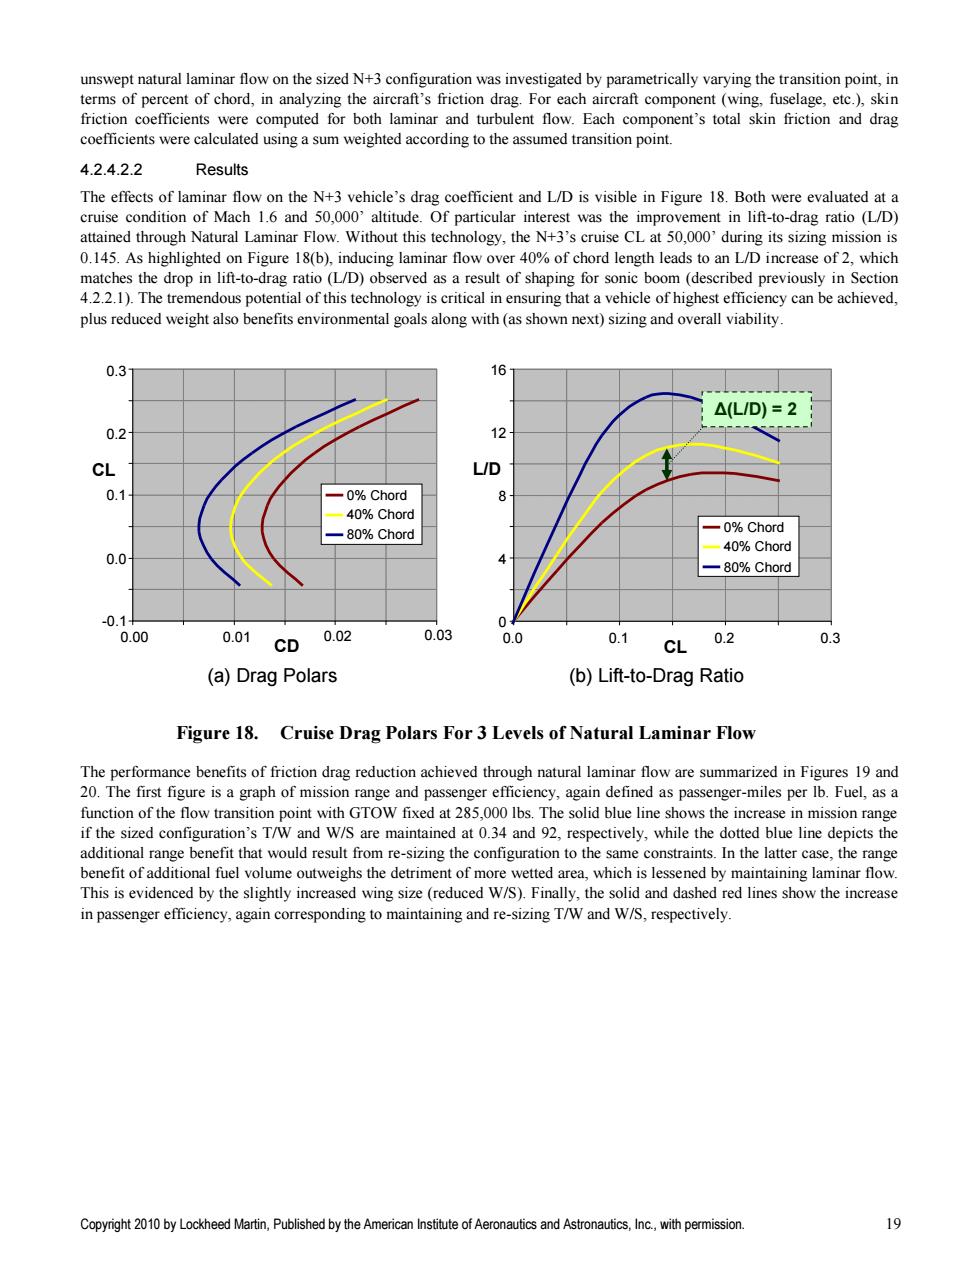
unswept natural laminar flow on the sized N+3 configuration was investigated by parametrically varying the transition point,in terms of percent of chord,in analyzing the aircraft's friction drag.For each aircraft component (wing,fuselage,etc.)skin friction coefficients were computed for both laminar and turbulent flow.Each component's total skin friction and drag coefficients were calculated using a sum weighted according to the assumed transition point. 4.2.4.2.2 Results The effects of laminar flow on the N+3 vehicle's drag coefficient and L/D is visible in Figure 18.Both were evaluated at a cruise condition of Mach 1.6 and 50,000'altitude.Of particular interest was the improvement in lift-to-drag ratio (L/D) attained through Natural Laminar Flow.Without this technology,the N+3's cruise CL at 50,000'during its sizing mission is 0.145.As highlighted on Figure 18(b),inducing laminar flow over 40%of chord length leads to an L/D increase of 2,which matches the drop in lift-to-drag ratio (L/D)observed as a result of shaping for sonic boom(described previously in Section 4.2.2.1).The tremendous potential of this technology is critical in ensuring that a vehicle of highest efficiency can be achieved, plus reduced weight also benefits environmental goals along with(as shown next)sizing and overall viability 0.3 16 △(L/D)=2 0.2 12 CL L/D 0.1- -0%Chord 8 40%Chord -80%Chord -0%Chord 40%Chord 0.0 -80%Chord -0.1+ 0 0.00 0.01 CD 0.02 0.03 0.0 0.1 CL 0.2 0.3 (a)Drag Polars (b)Lift-to-Drag Ratio Figure 18.Cruise Drag Polars For 3 Levels of Natural Laminar Flow The performance benefits of friction drag reduction achieved through natural laminar flow are summarized in Figures 19 and 20.The first figure is a graph of mission range and passenger efficiency,again defined as passenger-miles per Ib.Fuel,as a function of the flow transition point with GTOW fixed at 285,000 lbs.The solid blue line shows the increase in mission range if the sized configuration's T/W and W/S are maintained at 0.34 and 92,respectively,while the dotted blue line depicts the additional range benefit that would result from re-sizing the configuration to the same constraints.In the latter case,the range benefit of additional fuel volume outweighs the detriment of more wetted area,which is lessened by maintaining laminar flow. This is evidenced by the slightly increased wing size(reduced W/S).Finally,the solid and dashed red lines show the increase in passenger efficiency,again corresponding to maintaining and re-sizing T/W and W/S,respectively. Copyright 2010 by Lockheed Martin,Published by the American Institute of Aeronautics and Astronautics,Inc.,with permission. 19
Copyright 2010 by Lockheed Martin, Published by the American Institute of Aeronautics and Astronautics, Inc., with permission. 19 unswept natural laminar flow on the sized N+3 configuration was investigated by parametrically varying the transition point, in terms of percent of chord, in analyzing the aircraft‘s friction drag. For each aircraft component (wing, fuselage, etc.), skin friction coefficients were computed for both laminar and turbulent flow. Each component‘s total skin friction and drag coefficients were calculated using a sum weighted according to the assumed transition point. 4.2.4.2.2 Results The effects of laminar flow on the N+3 vehicle‘s drag coefficient and L/D is visible in Figure 18. Both were evaluated at a cruise condition of Mach 1.6 and 50,000‘ altitude. Of particular interest was the improvement in lift-to-drag ratio (L/D) attained through Natural Laminar Flow. Without this technology, the N+3‘s cruise CL at 50,000‘ during its sizing mission is 0.145. As highlighted on Figure 18(b), inducing laminar flow over 40% of chord length leads to an L/D increase of 2, which matches the drop in lift-to-drag ratio (L/D) observed as a result of shaping for sonic boom (described previously in Section 4.2.2.1). The tremendous potential of this technology is critical in ensuring that a vehicle of highest efficiency can be achieved, plus reduced weight also benefits environmental goals along with (as shown next) sizing and overall viability. Figure 18. Cruise Drag Polars For 3 Levels of Natural Laminar Flow The performance benefits of friction drag reduction achieved through natural laminar flow are summarized in Figures 19 and 20. The first figure is a graph of mission range and passenger efficiency, again defined as passenger-miles per lb. Fuel, as a function of the flow transition point with GTOW fixed at 285,000 lbs. The solid blue line shows the increase in mission range if the sized configuration‘s T/W and W/S are maintained at 0.34 and 92, respectively, while the dotted blue line depicts the additional range benefit that would result from re-sizing the configuration to the same constraints. In the latter case, the range benefit of additional fuel volume outweighs the detriment of more wetted area, which is lessened by maintaining laminar flow. This is evidenced by the slightly increased wing size (reduced W/S). Finally, the solid and dashed red lines show the increase in passenger efficiency, again corresponding to maintaining and re-sizing T/W and W/S, respectively. -0.1 0.0 0.1 0.2 0.3 0.00 0.01 0.02 0.03 CD CL 0% Chord 40% Chord 80% Chord 0 4 8 12 16 0.0 0.1 0.2 0.3 CL L/D 0% Chord 40% Chord 80% Chord (a) Drag Polars (b) Lift-to-Drag Ratio Δ(L/D) = 2