
WING PLANFORM 50 40 Jeds 10 0 100 120 140 160 180 200 220 FS FEET(nose at 8.333) Figure 8. Wing Trailing Edge Swept to Maximize Compression Lift and Shock(and Drag) Cancellation from Airfoil Reflex T-Tail Configuration The T-tail configuration was considered in order to raise the aft lift and stretch the boom signature. The configuration reduces interference drag and eliminates the inverted-V structure.A set of coarse geometry trades was performed to reduce the T-tail's sonic boom level while minimizing adverse impacts to drag.These trades followed the same approach used on the inverted V-tail,which is described in Section 4.2.1.Results for both configurations are provided in Table 4 in that section. This configuration was not considered further,however,because it also entailed an increase in wing weight(because the T-tail does not help support the wing as the inverted V-tail does),possible flutter issues,and a larger fin. Oblique Wing Configuration Oblique wings have been studied since the 1970's and have been proven to provide good aerodynamic performance at supersonic and subsonic speeds.The variable sweep allows better aerodynamic optimization at a variety of Mach numbers.If the takeoff constraint is driving the wing size,this would allow for a smaller wing with good low-speed,transonic,and supersonic performance.The smaller wing would require less thrust,possibly requiring fewer engines. However,an oblique wing design complicates the boom design and introduces a weight penalty with the wing pivot mechanism.Analysis of the area distributions was performed to determine whether the complications to the boom design could be overcome. Figure 9 shows area distributions at Mach I for the components and area distributions for the combined vehicle at Mach 1.6 for roll angles from 0 to 180 degrees.The Mach I area distribution shows one of the benefits of the oblique wing,in that the area of the wing is spread over a greater length of the vehicle than a traditional wing,which can help reduce wave drag.The Mach 1.6 area distributions show that there are some smile angles that are better than others.For a smile angle that causes the Mach angle to align more closely with the wing,the wing appears quickly in the area distribution,increasing that angle's contribution to wave drag. Copyright 2010 by Lockheed Martin,Published by the American Institute of Aeronautics and Astronautics,Inc.,with permission. 11
Copyright 2010 by Lockheed Martin, Published by the American Institute of Aeronautics and Astronautics, Inc., with permission. 11 0 10 20 30 40 50 100 120 140 160 180 200 220 BL FEET FS FEET (nose at 8.333) WING PLANFORM Rear Spar 0 10 20 30 40 50 100 120 140 160 180 200 220 Figure 8. Wing Trailing Edge Swept to Maximize Compression Lift and Shock (and Drag) Cancellation from Airfoil Reflex T-Tail Configuration The T-tail configuration was considered in order to raise the aft lift and stretch the boom signature. The configuration reduces interference drag and eliminates the inverted-V structure. A set of coarse geometry trades was performed to reduce the T-tail‘s sonic boom level while minimizing adverse impacts to drag. These trades followed the same approach used on the inverted V-tail, which is described in Section 4.2.1. Results for both configurations are provided in Table 4 in that section. This configuration was not considered further, however, because it also entailed an increase in wing weight (because the T-tail does not help support the wing as the inverted V-tail does), possible flutter issues, and a larger fin. Oblique Wing Configuration Oblique wings have been studied since the 1970‘s and have been proven to provide good aerodynamic performance at supersonic and subsonic speeds. The variable sweep allows better aerodynamic optimization at a variety of Mach numbers. If the takeoff constraint is driving the wing size, this would allow for a smaller wing with good low-speed, transonic, and supersonic performance. The smaller wing would require less thrust, possibly requiring fewer engines. However, an oblique wing design complicates the boom design and introduces a weight penalty with the wing pivot mechanism. Analysis of the area distributions was performed to determine whether the complications to the boom design could be overcome. Figure 9 shows area distributions at Mach 1 for the components and area distributions for the combined vehicle at Mach 1.6 for roll angles from 0 to 180 degrees. The Mach 1 area distribution shows one of the benefits of the oblique wing, in that the area of the wing is spread over a greater length of the vehicle than a traditional wing, which can help reduce wave drag. The Mach 1.6 area distributions show that there are some smile angles that are better than others. For a smile angle that causes the Mach angle to align more closely with the wing, the wing appears quickly in the area distribution, increasing that angle‘s contribution to wave drag
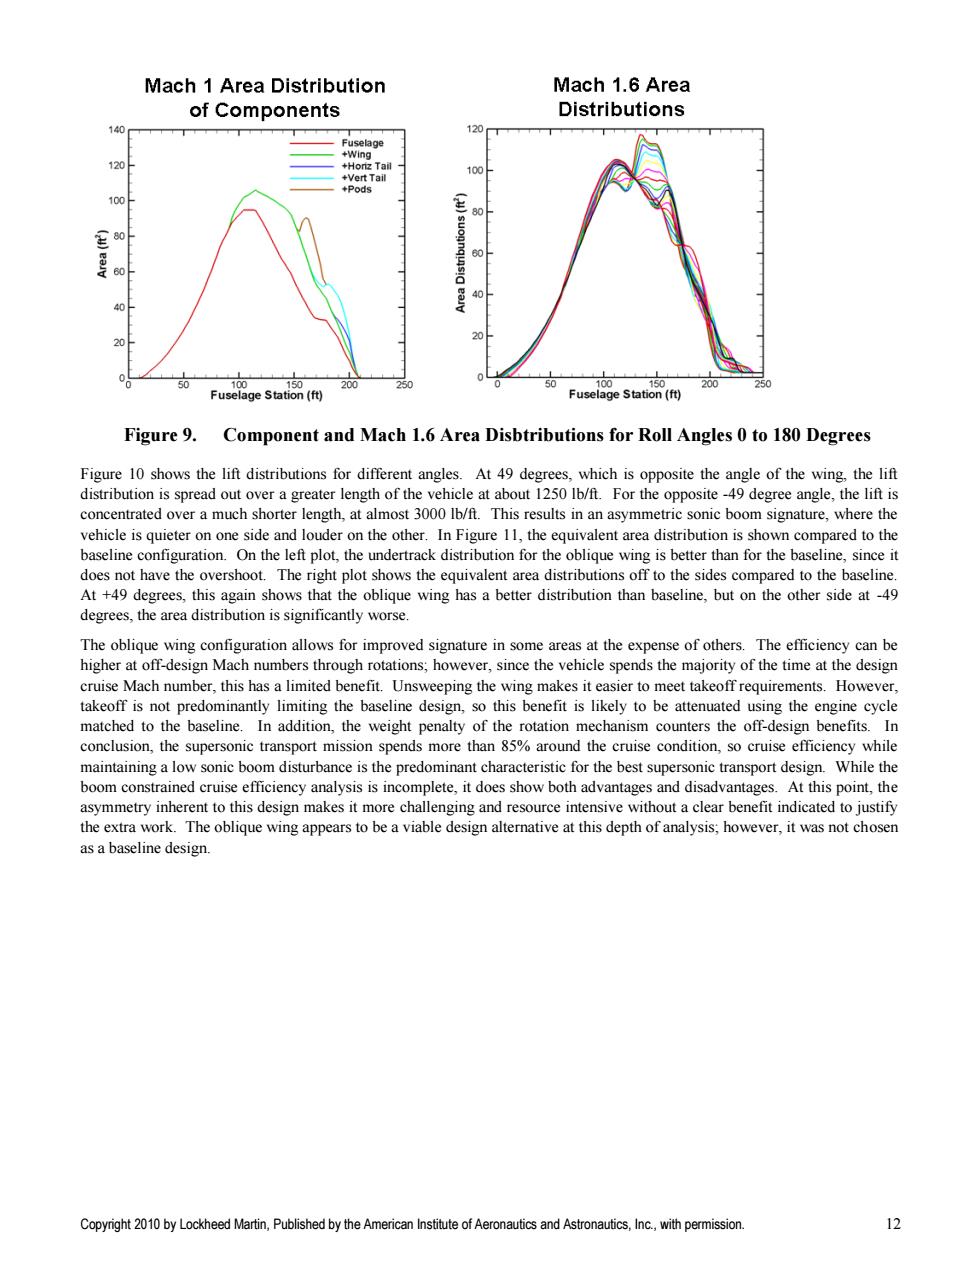
Mach 1 Area Distribution Mach 1.6 Area of Components Distributions 140 120 Fuselage +Wing 120 +Hori位Tal +Vert Tail 100 +Pods 100F 王 80 至80 suognqisig 60 40 20 50 100 150 200 250 50 250 Fuselage Station(ft) Fuselage Station(ft) 2 Figure 9.Component and Mach 1.6 Area Disbtributions for Roll Angles 0 to 180 Degrees Figure 10 shows the lift distributions for different angles.At 49 degrees,which is opposite the angle of the wing,the lift distribution is spread out over a greater length of the vehicle at about 1250 Ib/ft.For the opposite-49 degree angle,the lift is concentrated over a much shorter length,at almost 3000 Ib/ft.This results in an asymmetric sonic boom signature,where the vehicle is quieter on one side and louder on the other.In Figure 11,the equivalent area distribution is shown compared to the baseline configuration.On the left plot,the undertrack distribution for the oblique wing is better than for the baseline,since it does not have the overshoot.The right plot shows the equivalent area distributions off to the sides compared to the baseline. At +49 degrees,this again shows that the oblique wing has a better distribution than baseline,but on the other side at-49 degrees,the area distribution is significantly worse. The oblique wing configuration allows for improved signature in some areas at the expense of others.The efficiency can be higher at off-design Mach numbers through rotations;however,since the vehicle spends the majority of the time at the design cruise Mach number,this has a limited benefit.Unsweeping the wing makes it easier to meet takeoff requirements.However, takeoff is not predominantly limiting the baseline design,so this benefit is likely to be attenuated using the engine cycle matched to the baseline.In addition,the weight penalty of the rotation mechanism counters the off-design benefits.In conclusion,the supersonic transport mission spends more than 85%around the cruise condition,so cruise efficiency while maintaining a low sonic boom disturbance is the predominant characteristic for the best supersonic transport design.While the boom constrained cruise efficiency analysis is incomplete,it does show both advantages and disadvantages.At this point,the asymmetry inherent to this design makes it more challenging and resource intensive without a clear benefit indicated to justify the extra work.The oblique wing appears to be a viable design alternative at this depth of analysis;however,it was not chosen as a baseline design. Copyright 2010 by Lockheed Martin,Published by the American Institute of Aeronautics and Astronautics,Inc.,with permission. 12
Copyright 2010 by Lockheed Martin, Published by the American Institute of Aeronautics and Astronautics, Inc., with permission. 12 Figure 9. Component and Mach 1.6 Area Disbtributions for Roll Angles 0 to 180 Degrees Figure 10 shows the lift distributions for different angles. At 49 degrees, which is opposite the angle of the wing, the lift distribution is spread out over a greater length of the vehicle at about 1250 lb/ft. For the opposite -49 degree angle, the lift is concentrated over a much shorter length, at almost 3000 lb/ft. This results in an asymmetric sonic boom signature, where the vehicle is quieter on one side and louder on the other. In Figure 11, the equivalent area distribution is shown compared to the baseline configuration. On the left plot, the undertrack distribution for the oblique wing is better than for the baseline, since it does not have the overshoot. The right plot shows the equivalent area distributions off to the sides compared to the baseline. At +49 degrees, this again shows that the oblique wing has a better distribution than baseline, but on the other side at -49 degrees, the area distribution is significantly worse. The oblique wing configuration allows for improved signature in some areas at the expense of others. The efficiency can be higher at off-design Mach numbers through rotations; however, since the vehicle spends the majority of the time at the design cruise Mach number, this has a limited benefit. Unsweeping the wing makes it easier to meet takeoff requirements. However, takeoff is not predominantly limiting the baseline design, so this benefit is likely to be attenuated using the engine cycle matched to the baseline. In addition, the weight penalty of the rotation mechanism counters the off-design benefits. In conclusion, the supersonic transport mission spends more than 85% around the cruise condition, so cruise efficiency while maintaining a low sonic boom disturbance is the predominant characteristic for the best supersonic transport design. While the boom constrained cruise efficiency analysis is incomplete, it does show both advantages and disadvantages. At this point, the asymmetry inherent to this design makes it more challenging and resource intensive without a clear benefit indicated to justify the extra work. The oblique wing appears to be a viable design alternative at this depth of analysis; however, it was not chosen as a baseline design

3500 ◆-49 3000 -40 30 2500 -20 ÷-10 /sql 2000 Phi=0 0 1500 20 30 名 1000 40 49 500 0 0 50 100 150 200 250 -500 X-Beta*R,ft Figure 10. Lift distributions at different angles 300 -Oblique Phi=-49 350 Oblique Phi =0 Oblique Phi=+49 -Baseline Phi=0 Baseline Phi=49 20m 200 150 100 100 50 0 01 150 2a0 250 t00 150 200 250 X-Beta'R X-Beta'R Figure 11. Equivalent area distribution undertrack(left),and carpet edge(right)for oblique wing and baseline configuration Twin Fuselage Configuration The twin fuselage configuration is another proposed N+3 configuration but presented fuel efficiency and boom design complications.The benefit of the twin fuselage configuration is the favorable interference between the fuselages that reduce drag.The fuselage weight is also split on the wing,reducing bending moment and wing structural weight.With the separation distance between the two fuselages,the far-field method would not accurately predict wave drag.Using an appropriate near-field method,the twin fuselage's favorable interference at optimal separation was small (less than 2%drag reduction)while the minimum practical cabin cross-section created a large fineness ratio penalty for the 100-200 passenger size.The twin fuselages'increased surface area skin friction and increased cross-section wave drag overwhelmed the possible wing structural benefit,prompting the elimination of this configuration. Mother/Daughter Configuration The mother/daughter concept involves 2 vehicles:a"daughter"optimized for cruise(high wing loading,thrust sized for cruise) and not subject to any takeoff field constraints,and a "mother"optimized for takeoff and landing performance(low wing loading,thrust sized for takeoff)without prioritizing cruise efficiency.Operations would involve the 2 vehicles taking off in tandem,relying partly on the mother's thrust for takeoff and climb.The pair then separates upon attaining cruise altitude,at Copyright 2010 by Lockheed Martin,Published by the American Institute of Aeronautics and Astronautics,Inc.,with permission. 13
Copyright 2010 by Lockheed Martin, Published by the American Institute of Aeronautics and Astronautics, Inc., with permission. 13 Figure 10. Lift distributions at different angles Figure 11. Equivalent area distribution undertrack (left), and carpet edge (right) for oblique wing and baseline configuration Twin Fuselage Configuration The twin fuselage configuration is another proposed N+3 configuration but presented fuel efficiency and boom design complications. The benefit of the twin fuselage configuration is the favorable interference between the fuselages that reduce drag. The fuselage weight is also split on the wing, reducing bending moment and wing structural weight. With the separation distance between the two fuselages, the far-field method would not accurately predict wave drag. Using an appropriate near-field method, the twin fuselage‘s favorable interference at optimal separation was small (less than 2% drag reduction) while the minimum practical cabin cross-section created a large fineness ratio penalty for the 100-200 passenger size. The twin fuselages‘ increased surface area skin friction and increased cross-section wave drag overwhelmed the possible wing structural benefit, prompting the elimination of this configuration. Mother/Daughter Configuration The mother/daughter concept involves 2 vehicles: a ―daughter‖ optimized for cruise (high wing loading, thrust sized for cruise) and not subject to any takeoff field constraints, and a ―mother‖ optimized for takeoff and landing performance (low wing loading, thrust sized for takeoff) without prioritizing cruise efficiency. Operations would involve the 2 vehicles taking off in tandem, relying partly on the mother‘s thrust for takeoff and climb. The pair then separates upon attaining cruise altitude, at
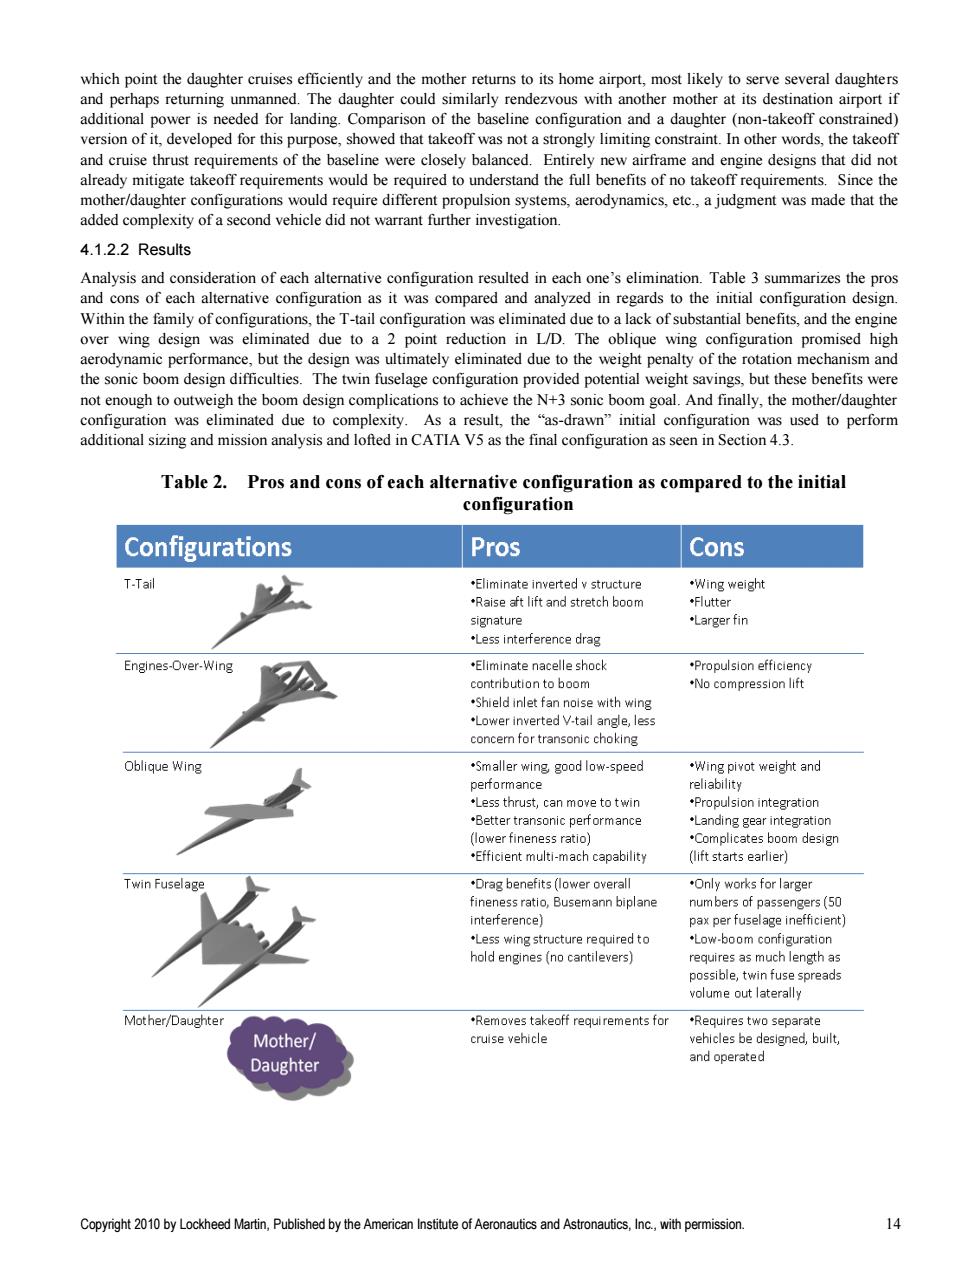
which point the daughter cruises efficiently and the mother returns to its home airport,most likely to serve several daughters and perhaps returning unmanned.The daughter could similarly rendezvous with another mother at its destination airport if additional power is needed for landing.Comparison of the baseline configuration and a daughter(non-takeoff constrained) version of it,developed for this purpose,showed that takeoff was not a strongly limiting constraint.In other words,the takeoff and cruise thrust requirements of the baseline were closely balanced.Entirely new airframe and engine designs that did not already mitigate takeoff requirements would be required to understand the full benefits of no takeoff requirements.Since the mother/daughter configurations would require different propulsion systems,aerodynamics,etc.,a judgment was made that the added complexity of a second vehicle did not warrant further investigation. 4.1.2.2 Results Analysis and consideration of each alternative configuration resulted in each one's elimination.Table 3 summarizes the pros and cons of each alternative configuration as it was compared and analyzed in regards to the initial configuration design. Within the family of configurations,the T-tail configuration was eliminated due to a lack of substantial benefits,and the engine over wing design was eliminated due to a 2 point reduction in L/D.The oblique wing configuration promised high aerodynamic performance,but the design was ultimately eliminated due to the weight penalty of the rotation mechanism and the sonic boom design difficulties.The twin fuselage configuration provided potential weight savings,but these benefits were not enough to outweigh the boom design complications to achieve the N+3 sonic boom goal.And finally,the mother/daughter configuration was eliminated due to complexity.As a result,the "as-drawn"initial configuration was used to perform additional sizing and mission analysis and lofted in CATIA V5 as the final configuration as seen in Section 4.3. Table 2.Pros and cons of each alternative configuration as compared to the initial configuration Configurations Pros Cons T-Tail Eliminate inverted v structure .Wing weight 'Raise aft lift and stretch boom .Flutter signature Larger fin .Less interference drag Engines-Over-Wing .Eliminate nacelle shock .Propulsion efficiency contribution to boom .No compression lift .Shield inlet fan noise with wing Lower inverted V-tail angle,less concern for transonic choking Oblique Wing .Smaller wing good low-speed .Wing pivot weight and performance reliability .Less thrust,can move to twin .Propulsion integration Better transonic performance Landing gear integration (lower fineness ratio) Complicates boom design .Efficient multi-mach capability (lift starts earlier) Twin Fuselage Drag benefits(lower overall .Only works for larger fineness ratio,Busemann biplane num bers of passengers(50 interference) pax per fuselage inefficient) Less wing structure required to Low-boom configuration hold engines(no cantilevers) requires as much length as possible,twin fuse spreads volume out laterally Mot her/Daughter Removes takeoff requirements for *Requires two separate Mother/ cruise vehicle vehicles be designed,built, Daughter and operated Copyright 2010 by Lockheed Martin,Published by the American Institute of Aeronautics and Astronautics,Inc.,with permission. 14
Copyright 2010 by Lockheed Martin, Published by the American Institute of Aeronautics and Astronautics, Inc., with permission. 14 which point the daughter cruises efficiently and the mother returns to its home airport, most likely to serve several daughters and perhaps returning unmanned. The daughter could similarly rendezvous with another mother at its destination airport if additional power is needed for landing. Comparison of the baseline configuration and a daughter (non-takeoff constrained) version of it, developed for this purpose, showed that takeoff was not a strongly limiting constraint. In other words, the takeoff and cruise thrust requirements of the baseline were closely balanced. Entirely new airframe and engine designs that did not already mitigate takeoff requirements would be required to understand the full benefits of no takeoff requirements. Since the mother/daughter configurations would require different propulsion systems, aerodynamics, etc., a judgment was made that the added complexity of a second vehicle did not warrant further investigation. 4.1.2.2 Results Analysis and consideration of each alternative configuration resulted in each one‘s elimination. Table 3 summarizes the pros and cons of each alternative configuration as it was compared and analyzed in regards to the initial configuration design. Within the family of configurations, the T-tail configuration was eliminated due to a lack of substantial benefits, and the engine over wing design was eliminated due to a 2 point reduction in L/D. The oblique wing configuration promised high aerodynamic performance, but the design was ultimately eliminated due to the weight penalty of the rotation mechanism and the sonic boom design difficulties. The twin fuselage configuration provided potential weight savings, but these benefits were not enough to outweigh the boom design complications to achieve the N+3 sonic boom goal. And finally, the mother/daughter configuration was eliminated due to complexity. As a result, the ―as-drawn‖ initial configuration was used to perform additional sizing and mission analysis and lofted in CATIA V5 as the final configuration as seen in Section 4.3. Table 2. Pros and cons of each alternative configuration as compared to the initial configuration
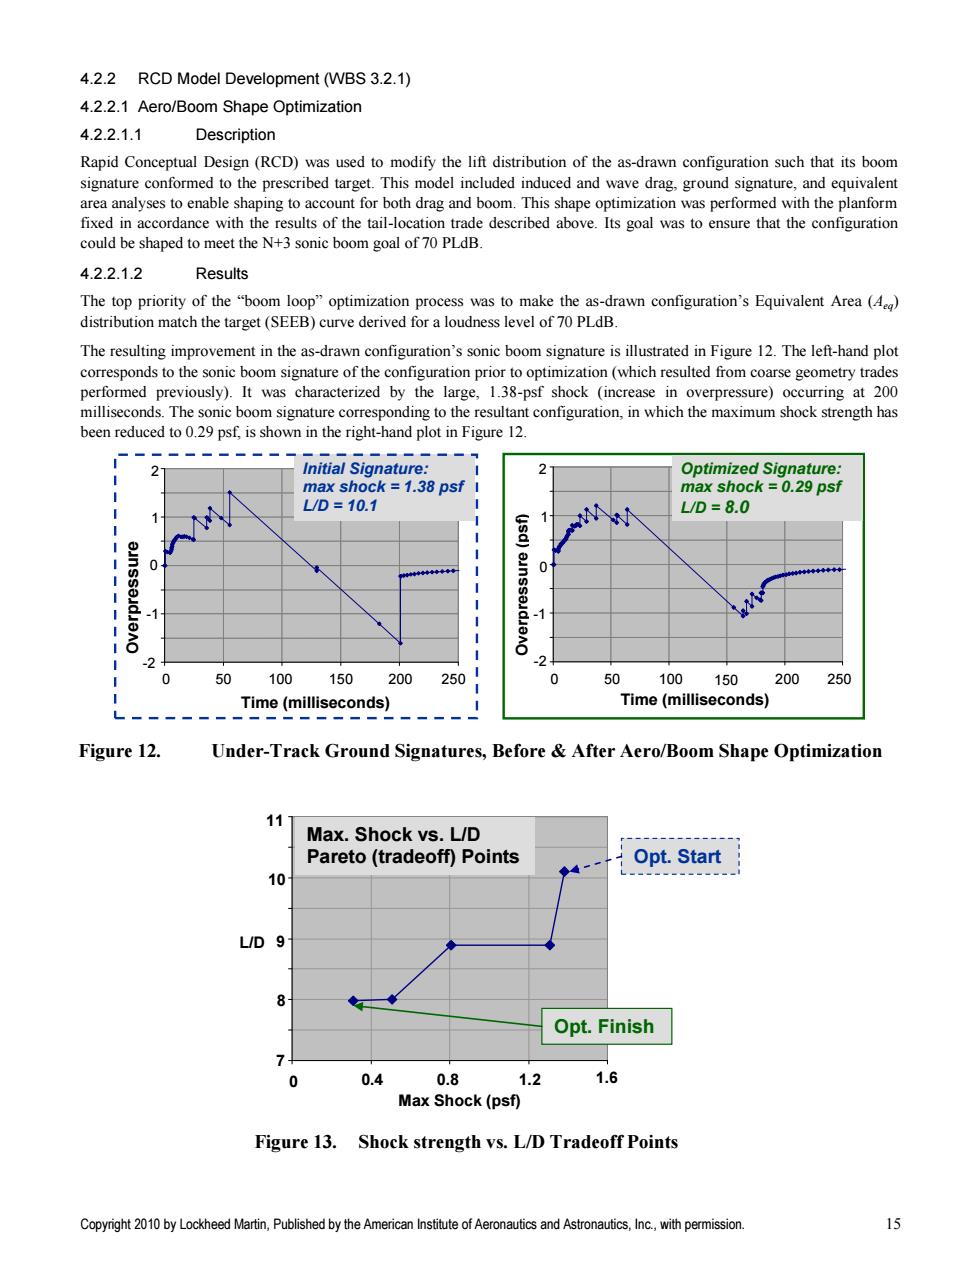
4.2.2 RCD Model Development (WBS 3.2.1) 4.2.2.1 Aero/Boom Shape Optimization 4.2.2.1.1 Description Rapid Conceptual Design(RCD)was used to modify the lift distribution of the as-drawn configuration such that its boom signature conformed to the prescribed target.This model included induced and wave drag,ground signature,and equivalent area analyses to enable shaping to account for both drag and boom.This shape optimization was performed with the planform fixed in accordance with the results of the tail-location trade described above.Its goal was to ensure that the configuration could be shaped to meet the N+3 sonic boom goal of 70 PLdB. 4.2.2.1.2 Results The top priority of the "boom loop"optimization process was to make the as-drawn configuration's Equivalent Area(A) distribution match the target(SEEB)curve derived for a loudness level of 70 PLdB. The resulting improvement in the as-drawn configuration's sonic boom signature is illustrated in Figure 12.The left-hand plot corresponds to the sonic boom signature of the configuration prior to optimization(which resulted from coarse geometry trades performed previously).It was characterized by the large,1.38-psf shock (increase in overpressure)occurring at 200 milliseconds.The sonic boom signature corresponding to the resultant configuration,in which the maximum shock strength has been reduced to 0.29 psf,is shown in the right-hand plot in Figure 12 Initial Signature: 2 Optimized Signature: max shock=1.38 psf I max shock =0.29 psf L/D=10.1 L1D=8.0 0 0 2 0 50 100 150 200 250 0 50 100 150 200 250 Time(milliseconds) Time(milliseconds) Figure 12. Under-Track Ground Signatures,Before After Aero/Boom Shape Optimization 11 Max.Shock vs.L/D Pareto(tradeoff)Points Opt.Start 10 L/D 9 8 Opt.Finish 0 0.4 0.8 1.2 1.6 Max Shock(psf) Figure 13.Shock strength vs.L/D Tradeoff Points Copyright 2010 by Lockheed Martin,Published by the American Institute of Aeronautics and Astronautics,Inc.,with permission. 15
Copyright 2010 by Lockheed Martin, Published by the American Institute of Aeronautics and Astronautics, Inc., with permission. 15 4.2.2 RCD Model Development (WBS 3.2.1) 4.2.2.1 Aero/Boom Shape Optimization 4.2.2.1.1 Description Rapid Conceptual Design (RCD) was used to modify the lift distribution of the as-drawn configuration such that its boom signature conformed to the prescribed target. This model included induced and wave drag, ground signature, and equivalent area analyses to enable shaping to account for both drag and boom. This shape optimization was performed with the planform fixed in accordance with the results of the tail-location trade described above. Its goal was to ensure that the configuration could be shaped to meet the N+3 sonic boom goal of 70 PLdB. 4.2.2.1.2 Results The top priority of the ―boom loop‖ optimization process was to make the as-drawn configuration‘s Equivalent Area (Aeq) distribution match the target (SEEB) curve derived for a loudness level of 70 PLdB. The resulting improvement in the as-drawn configuration‘s sonic boom signature is illustrated in Figure 12. The left-hand plot corresponds to the sonic boom signature of the configuration prior to optimization (which resulted from coarse geometry trades performed previously). It was characterized by the large, 1.38-psf shock (increase in overpressure) occurring at 200 milliseconds. The sonic boom signature corresponding to the resultant configuration, in which the maximum shock strength has been reduced to 0.29 psf, is shown in the right-hand plot in Figure 12. Figure 12. Under-Track Ground Signatures, Before & After Aero/Boom Shape Optimization Figure 13. Shock strength vs. L/D Tradeoff Points Opt. Start 7 8 9 10 11 0 0.4 0.8 1.2 1.6 Max Shock (psf) L/D Max. Shock vs. L/D Pareto (tradeoff) Points Opt. Finish -2 -1 0 1 2 0 50 100 150 200 250 Time (milliseconds) Overpressure (psf) Initial Signature: max shock = 1.38 psf L/D = 10.1 -2 -1 0 1 2 0 50 100 150 200 250 Time (milliseconds) Overpressure (psf) Optimized Signature: max shock = 0.29 psf L/D = 8.0