
Elasticity problems 55 Each time the first two probabilistic moments of the displacements are observed at the interface and on the tensioned vertical edge.In the case of stress expectations,location and maximum value of reduced stress are examined.Figures 2.23 and 2.24 demonstrate radial displacement coefficients of variation of points belonging to the fibre-matrix boundary,which depend on the angle B describing their locations on this boundary. The results of test no.1 (Table 2.2)are presented in Figure 2.23,and the next figure shows the results of test no.3;results of the remaining tests (no.2 and 4) agree with them respectively.In both cases coefficients of variation for 6=90 are omitted on the graphs because of their large values.For fibre contents equal to 50%,they are approximately 1.5 times greater than for =0(disproportion of the data would give an illegible picture).Therefore,it can be concluded that the randomness of displacements on the considered boundary depends mainly on the random character of fibre elastic properties,which means au(x]=a4[e]x∈021,2 (2.55) 0.103 0.101 0.099 0.097 00.095 0.093 -30%fiber contents 0.091 ····-40%fiber contents 50%fiber contents 0.089 0.087 0 11.25 22.5 33.75B 45 56.2567.5 78.75 Figure 2.23.Coefficients of variation in test no.1
Elasticity problems 55 Each time the first two probabilistic moments of the displacements are observed at the interface and on the tensioned vertical edge. In the case of stress expectations, location and maximum value of reduced stress are examined. Figures 2.23 and 2.24 demonstrate radial displacement coefficients of variation of points belonging to the fibre-matrix boundary, which depend on the angle β describing their locations on this boundary. The results of test no. 1 (Table 2.2) are presented in Figure 2.23, and the next figure shows the results of test no. 3; results of the remaining tests (no. 2 and 4) agree with them respectively. In both cases coefficients of variation for o θ = 90 are omitted on the graphs because of their large values. For fibre contents equal to 50%, they are approximately 1.5 times greater than for o θ = 0 (disproportion of the data would give an illegible picture). Therefore, it can be concluded that the randomness of displacements on the considered boundary depends mainly on the random character of fibre elastic properties, which means 1 1,2 α[u(x)] ≅ α[e ]; x ∈∂Ω (2.55) 0.087 0.089 0.091 0.093 0.095 0.097 0.099 0.101 0.103 0 11.25 22.5 33.75 45 56.25 67.5 78.75 β α 30% fiber contents 40% fiber contents 50% fiber contents Figure 2.23. Coefficients of variation in test no. 1
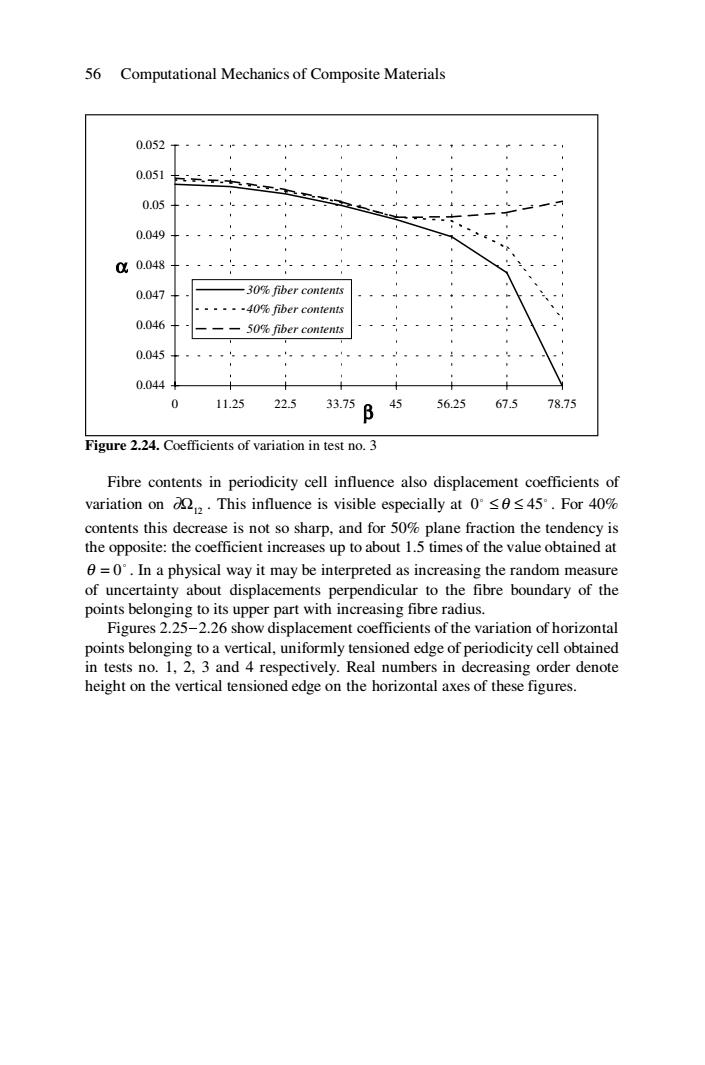
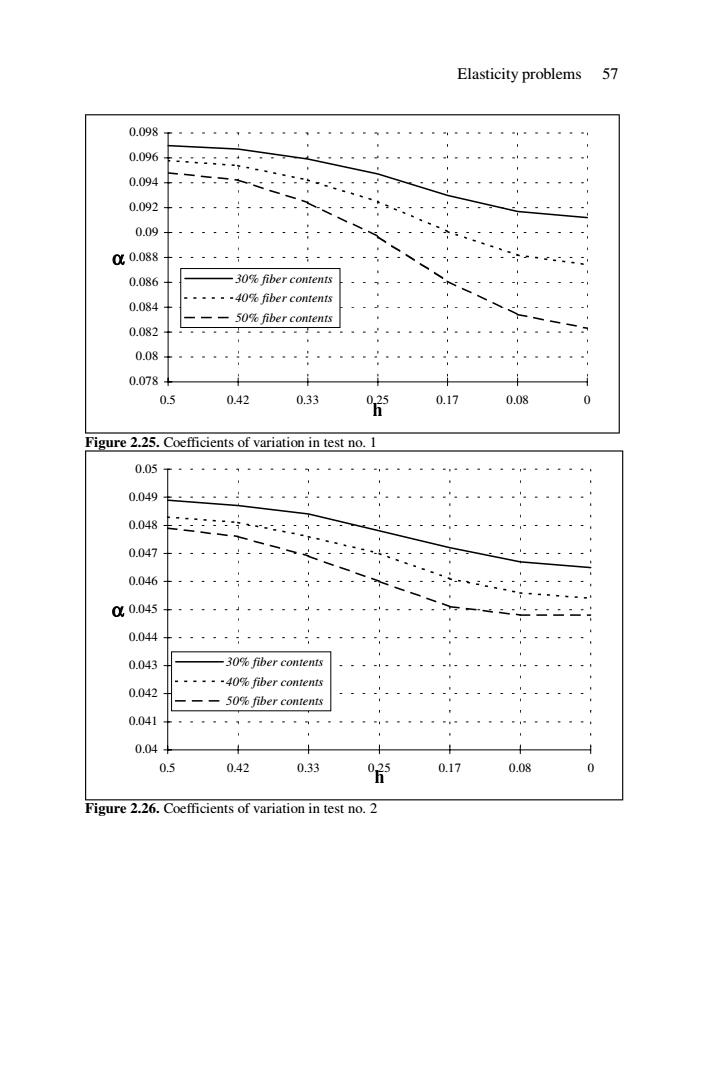
56 Computational Mechanics of Composite Materials 0.052 0.051 0.05 0.049 0a0.048 0.047 一30%fiber contents .·-·-4O%fiber contents 0.046 50%fiber contents 0.045 0.044 0 11.25 22.5 67.5 33.75B4556.25 78.75 Figure 2.24.Coefficients of variation in test no.3 Fibre contents in periodicity cell influence also displacement coefficients of variation on.This influence is visible especially at 045.For 40% contents this decrease is not so sharp,and for 50%plane fraction the tendency is the opposite:the coefficient increases up to about 1.5 times of the value obtained at 0=0'.In a physical way it may be interpreted as increasing the random measure of uncertainty about displacements perpendicular to the fibre boundary of the points belonging to its upper part with increasing fibre radius. Figures 2.25-2.26 show displacement coefficients of the variation of horizontal points belonging to a vertical,uniformly tensioned edge of periodicity cell obtained in tests no.1,2,3 and 4 respectively.Real numbers in decreasing order denote height on the vertical tensioned edge on the horizontal axes of these figures
56 Computational Mechanics of Composite Materials 0.044 0.045 0.046 0.047 0.048 0.049 0.05 0.051 0.052 0 11.25 22.5 33.75 45 56.25 67.5 78.75 β α 30% fiber contents 40% fiber contents 50% fiber contents Figure 2.24. Coefficients of variation in test no. 3 Fibre contents in periodicity cell influence also displacement coefficients of variation on Ω12 ∂ . This influence is visible especially at o o 0 ≤ θ ≤ 45 . For 40% contents this decrease is not so sharp, and for 50% plane fraction the tendency is the opposite: the coefficient increases up to about 1.5 times of the value obtained at o θ = 0 . In a physical way it may be interpreted as increasing the random measure of uncertainty about displacements perpendicular to the fibre boundary of the points belonging to its upper part with increasing fibre radius. Figures 2.25-2.26 show displacement coefficients of the variation of horizontal points belonging to a vertical, uniformly tensioned edge of periodicity cell obtained in tests no. 1, 2, 3 and 4 respectively. Real numbers in decreasing order denote height on the vertical tensioned edge on the horizontal axes of these figures
Elasticity problems 57 0.098 0.096 4 0.094 0.092 0.09 00.088 0.086 30%fiber contents ······40%fiber contents 0.084 一一 50%fiber contents 0.082 0.08 0.078 0.5 0.42 0.33 750.17 0.08 Figure 2.25.Coefficients of variation in test no.1 0.05 0.049 0.048 0.047 0.046 00.045 0.044 0.043 -30%fiber contents ······40%fiber con1enis 0.042 一-50%fiber contents 0.041 0.04 0.5 0.42 0.33 025 0.17 0.08 0 Figure 2.26.Coefficients of variation in test no.2
Elasticity problems 57 0.078 0.08 0.082 0.084 0.086 0.088 0.09 0.092 0.094 0.096 0.098 0.5 0.42 0.33 0.25 0.17 0.08 0 h α 30% fiber contents 40% fiber contents 50% fiber contents Figure 2.25. Coefficients of variation in test no. 1 0.04 0.041 0.042 0.043 0.044 0.045 0.046 0.047 0.048 0.049 0.05 0.5 0.42 0.33 0.25 0.17 0.08 0 h α 30% fiber contents 40% fiber contents 50% fiber contents Figure 2.26. Coefficients of variation in test no. 2
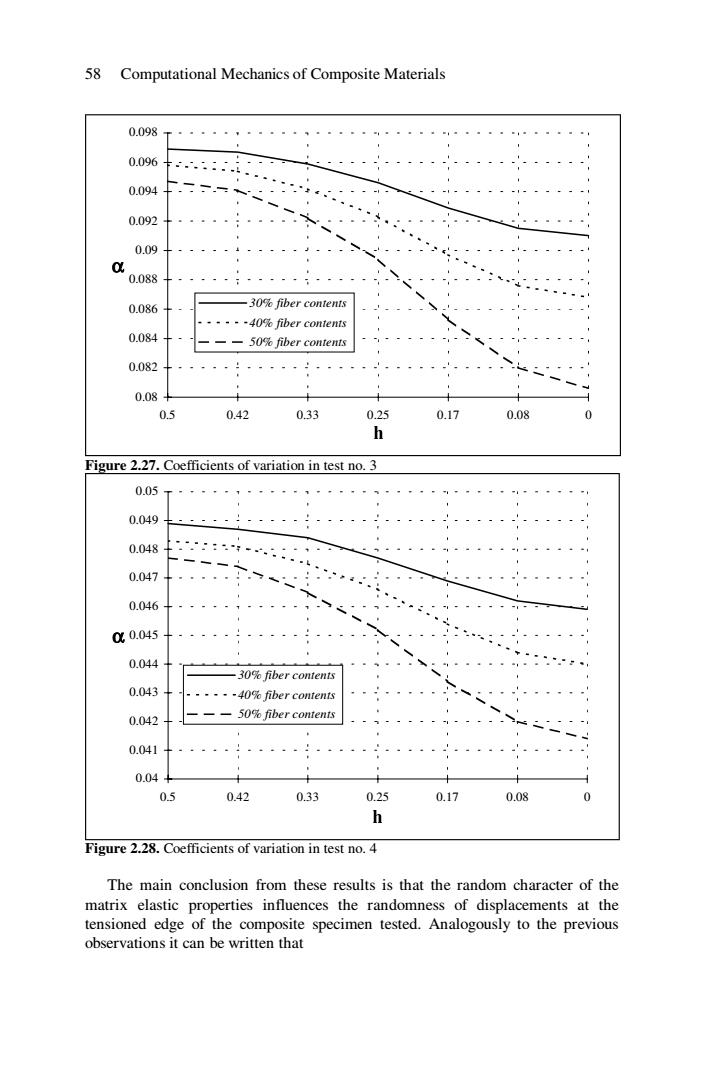
58 Computational Mechanics of Composite Materials 0.098 0.096 0.094 0.092 0.09 0 0.088 0.086 -30%fiber contents ·····-4O%fiber contents 0.084 --50%fiber contents 0.082 0.08 0.5 0.42 0.33 0.25 0.17 0.08 0 h Figure 2.27.Coefficients of variation in test no.3 0.05 0.049 0.048 0.047 0.046 00.045 0.044 一3O%fiber contents 0.043 .....-40%fiber contents 0.042 ---50%fiber contents 0.041 0.04+ 0.5 0.42 0.33 0.25 0.17 0.08 0 h Figure 2.28.Coefficients of variation in test no.4 The main conclusion from these results is that the random character of the matrix elastic properties influences the randomness of displacements at the tensioned edge of the composite specimen tested.Analogously to the previous observations it can be written that
58 Computational Mechanics of Composite Materials 0.08 0.082 0.084 0.086 0.088 0.09 0.092 0.094 0.096 0.098 0.5 0.42 0.33 0.25 0.17 0.08 0 h α 30% fiber contents 40% fiber contents 50% fiber contents Figure 2.27. Coefficients of variation in test no. 3 0.04 0.041 0.042 0.043 0.044 0.045 0.046 0.047 0.048 0.049 0.05 0.5 0.42 0.33 0.25 0.17 0.08 0 h α 30% fiber contents 40% fiber contents 50% fiber contents Figure 2.28. Coefficients of variation in test no. 4 The main conclusion from these results is that the random character of the matrix elastic properties influences the randomness of displacements at the tensioned edge of the composite specimen tested. Analogously to the previous observations it can be written that
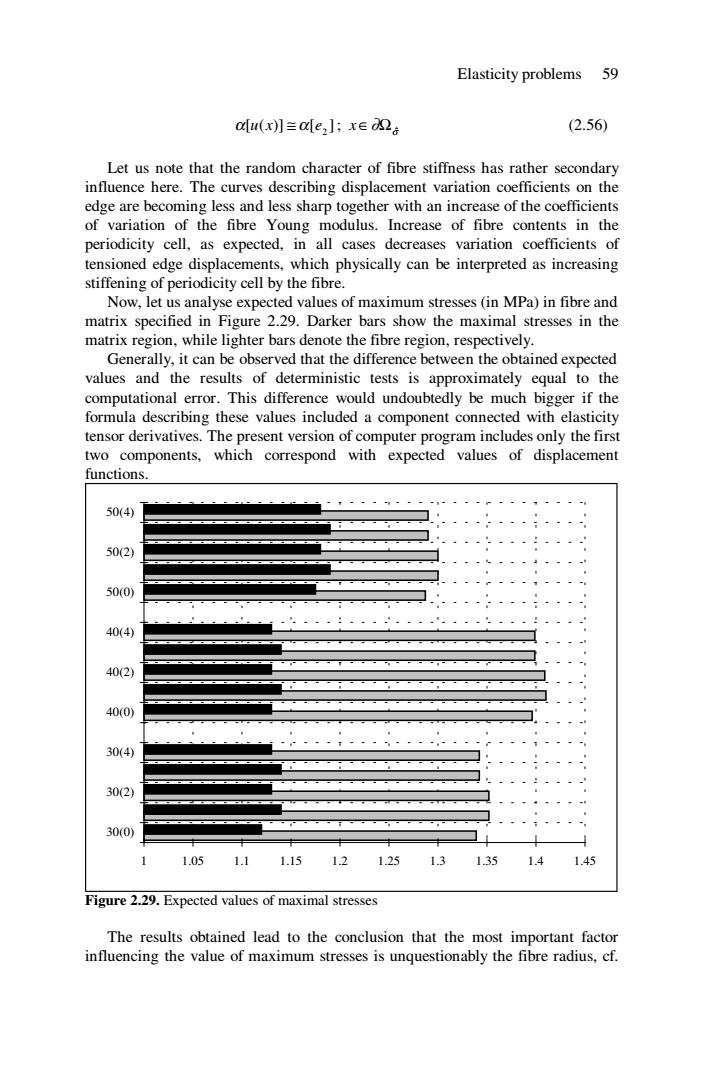
Elasticity problems 59 a[u(x]≡a[e,];xed2e (2.56) Let us note that the random character of fibre stiffness has rather secondary influence here.The curves describing displacement variation coefficients on the edge are becoming less and less sharp together with an increase of the coefficients of variation of the fibre Young modulus.Increase of fibre contents in the periodicity cell,as expected,in all cases decreases variation coefficients of tensioned edge displacements,which physically can be interpreted as increasing stiffening of periodicity cell by the fibre. Now,let us analyse expected values of maximum stresses (in MPa)in fibre and matrix specified in Figure 2.29.Darker bars show the maximal stresses in the matrix region,while lighter bars denote the fibre region,respectively. Generally,it can be observed that the difference between the obtained expected values and the results of deterministic tests is approximately equal to the computational error.This difference would undoubtedly be much bigger if the formula describing these values included a component connected with elasticity tensor derivatives.The present version of computer program includes only the first two components,which correspond with expected values of displacement functions. 50(4) 50(2) 50(0) 40(4) 40(2) 40(0) 30(4) 30(2) 30(0) 1.051.1 1.15121.251.31.35 1.4 1.45 Figure 2.29.Expected values of maximal stresses The results obtained lead to the conclusion that the most important factor influencing the value of maximum stresses is unquestionably the fibre radius,cf
Elasticity problems 59 [ ( )] [ ] 2 α u x ≅ α e ; σ x∈∂Ω ˆ (2.56) Let us note that the random character of fibre stiffness has rather secondary influence here. The curves describing displacement variation coefficients on the edge are becoming less and less sharp together with an increase of the coefficients of variation of the fibre Young modulus. Increase of fibre contents in the periodicity cell, as expected, in all cases decreases variation coefficients of tensioned edge displacements, which physically can be interpreted as increasing stiffening of periodicity cell by the fibre. Now, let us analyse expected values of maximum stresses (in MPa) in fibre and matrix specified in Figure 2.29. Darker bars show the maximal stresses in the matrix region, while lighter bars denote the fibre region, respectively. Generally, it can be observed that the difference between the obtained expected values and the results of deterministic tests is approximately equal to the computational error. This difference would undoubtedly be much bigger if the formula describing these values included a component connected with elasticity tensor derivatives. The present version of computer program includes only the first two components, which correspond with expected values of displacement functions. 1 1.05 1.1 1.15 1.2 1.25 1.3 1.35 1.4 1.45 30(0) 30(2) 30(4) 40(0) 40(2) 40(4) 50(0) 50(2) 50(4) Figure 2.29. Expected values of maximal stresses The results obtained lead to the conclusion that the most important factor influencing the value of maximum stresses is unquestionably the fibre radius, cf