c.senior executives The high earnings among senor executives will result in a relatively inelastic demand for membership 12.Explain which of the following items in each pair is more price elastic a.The demand for a specific brand of toothpaste and the demand for toothpaste in general. The demand for a specific brand is more elastie since the consumer can easily switch to another brand if the price goes up. b.The demand for gasoline in the short run and the demand for gasoline in the long run. Demand in the bng run is more elastic since consumers have had more time to adjust to the change in price. Explain the difference betw en a positive and a negative network one individual increases in response to the purchase of the good by other consumers.Fads are an example of a positive network externality.For example, each individuals demand for baggy pants increases as more other individuals begin to wear baggy pants.This is also called a bandwagon effect.A negative network externality exists if the quantity demanded of a good by one individual decre es in response to the purchase of the good by other consumers.In thi case the individual prefers to be different from other individuals.As more people adopt a particular style or purchase a particular type of good,this individual will reduce his demand for the good.Goods like designer clthing can have negative network externalities as some people would not want to wear the same clothes that many other people are wearng. 二、EXERCISES An indilts aside a certain amount of his income per month to spend on his two Given the information b illustrate both the price consum tion curve associated with changes in the price of wine,and the demand curve for wine. Price Price Quantity Quantity Budget Wine Book Wine Book S10 S10 S150 S12 $10 S150 S15 s10 4 9 s150 S20 S10 2 11 s150
c. senior executives The high earnings among senior executives will result in a relatively inelastic demand for membership. 12. Explain which of the following items in each pair is more price elastic. a. The demand for a specific brand of toothpaste and the demand for toothpaste in general. The demand for a specific brand is more elastic since the consumer can easily switch to another brand if the price goes up. b. The demand for gasoline in the short run and the demand for gasoline in the long run. Demand in the long run is more elastic since consumers have had more time to adjust to the change in price. 13. Explain the difference between a positive and a negative network externality, and give an example of each. A positive network externality exists if the quantity demanded of a good by one individual increases in response to the purchase of the good by other consumers. Fads are an example of a positive network externality. For example, each individuals demand for baggy pants increases as more other individuals begin to wear baggy pants. This is also called a bandwagon effect. A negative network externality exists if the quantity demanded of a good by one individual decreases in response to the purchase of the good by other consumers. In this case the individual prefers to be different from other individuals. As more people adopt a particular style or purchase a particular type of good, this individual will reduce his demand for the good. Goods like designer clothing can have negative network externalities as some people would not want to wear the same clothes that many other people are wearing. 二、EXERCISES 1. An individual sets aside a certain amount of his income per month to spend on his two hobbies, collecting wine and collecting books. Given the information below, illustrate both the price consumption curve associated with changes in the price of wine, and the demand curve for wine. Price Wine Price Book Quantity Wine Quantity Book Budget $10 $10 7 8 $150 $12 $10 5 9 $150 $15 $10 4 9 $150 $20 $10 2 11 $150
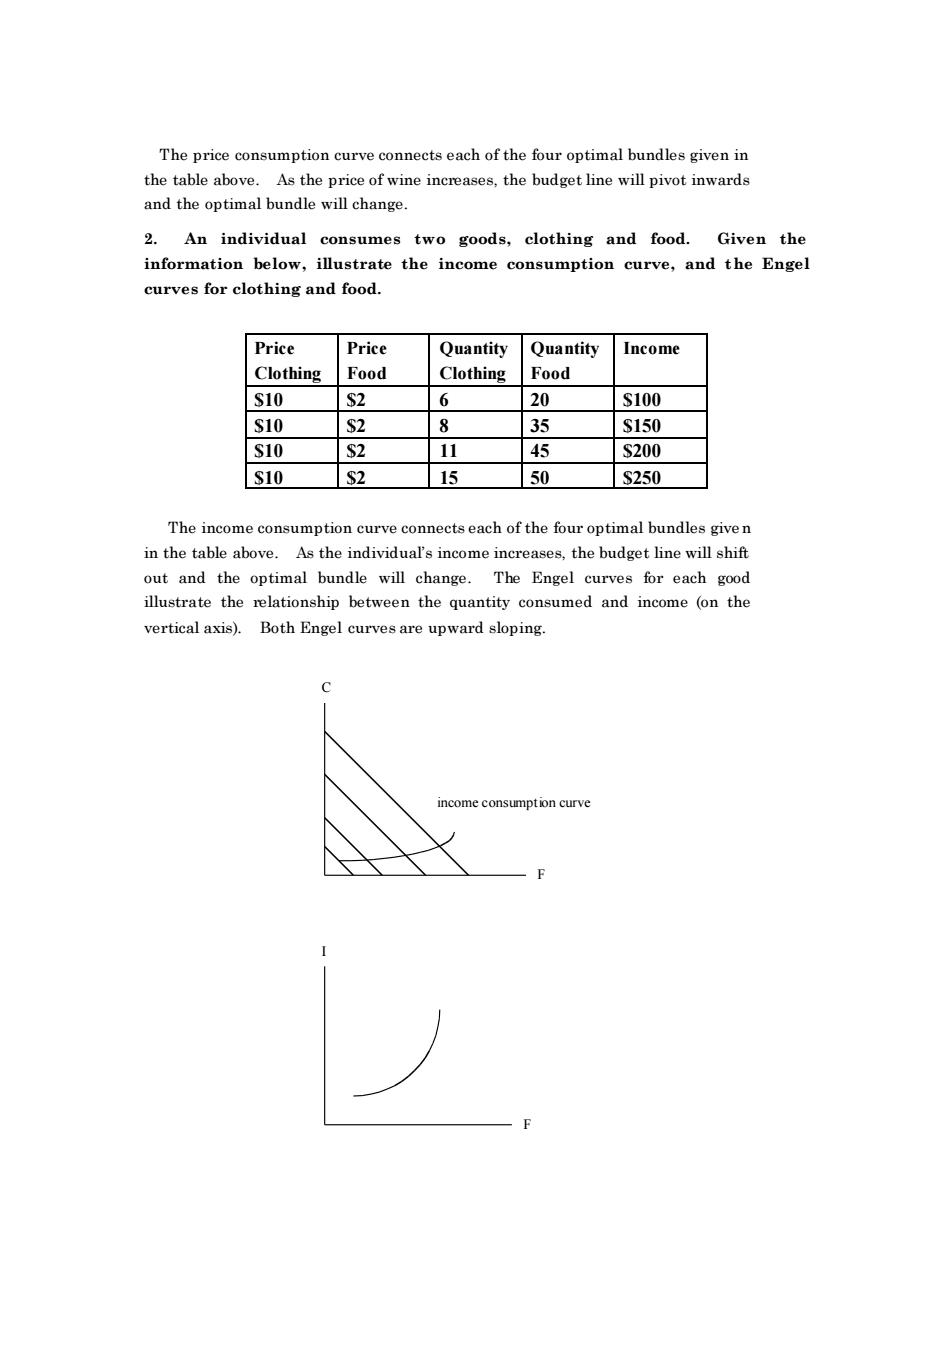
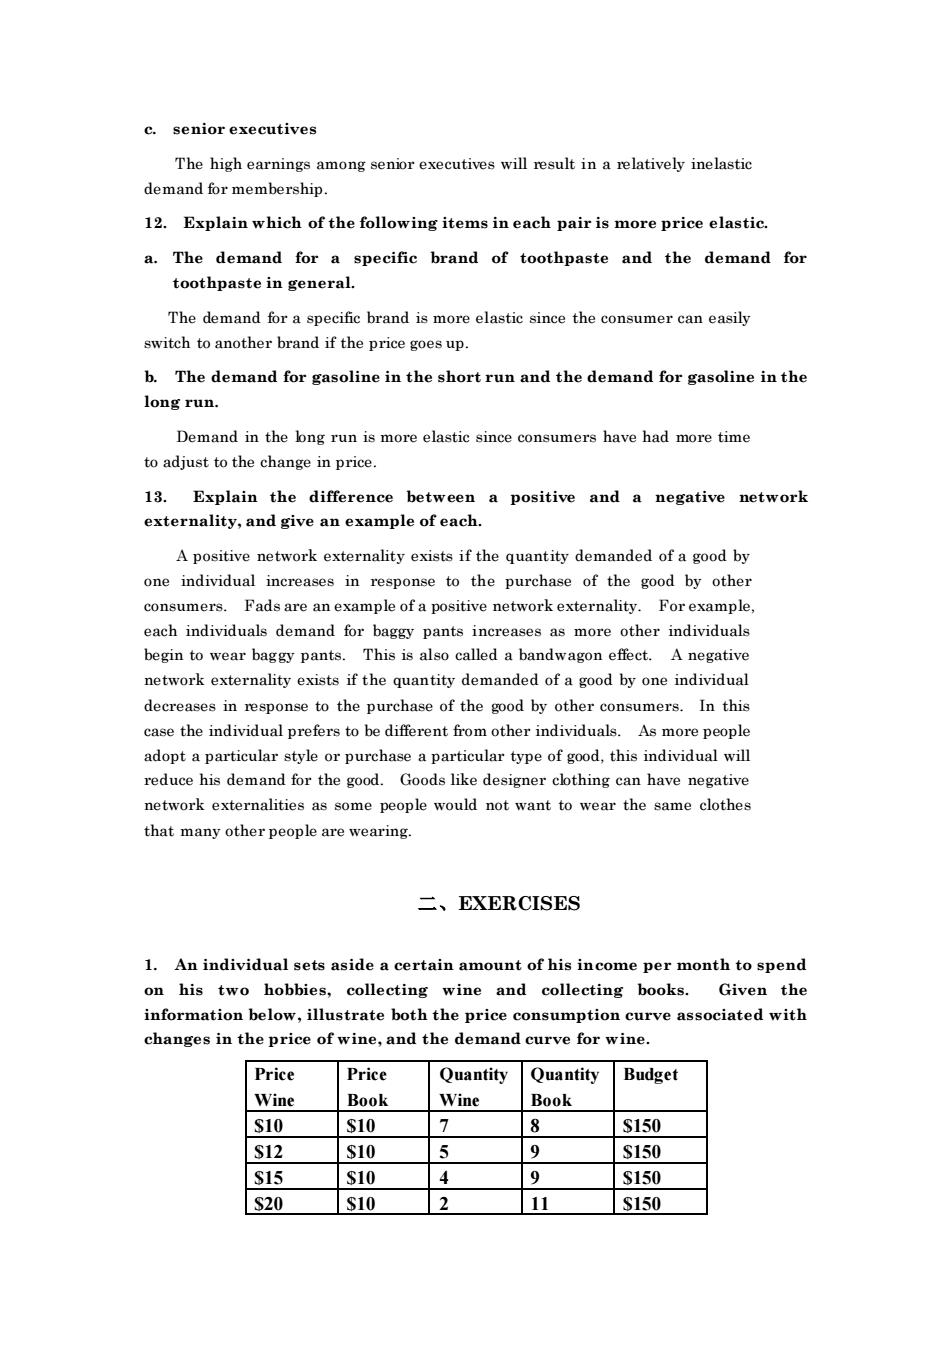
The price consumption curve of the four optimal bundles given i the table above. As the price of wine increases,the budget line will pivot inward and the optimal bundle will change. 2.An individual consumes two goods,clothing and food.Given the information below,illustrate the income consumption curve,and the Engel curves for clothing and food. Price Price Quantity Quantity Income Clothing Food Clothing Food S10 S2 6 20 S100 S10 R 35 S150 S70 11 S200 S10 S2 15 50 S250 The income consumption curve connects each of the four optimal bundles give n in the table above. As the individual's income incre ases the budget line will shift out and the bundle will hange. The Engel curv for each goo illustrate the relationship between the quantity consumed and income (on the vertical axis).Both Engel curves are upward sloping. income consumption curve
The price consumption curve connects each of the four optimal bundles given in the table above. As the price of wine increases, the budget line will pivot inwards and the optimal bundle will change. 2. An individual consumes two goods, clothing and food. Given the information below, illustrate the income consumption curve, and the Engel curves for clothing and food. Price Clothing Price Food Quantity Clothing Quantity Food Income $10 $2 6 20 $100 $10 $2 8 35 $150 $10 $2 11 45 $200 $10 $2 15 50 $250 The income consumption curve connects each of the four optimal bundles given in the table above. As the individual’s income increases, the budget line will shift out and the optimal bundle will change. The Engel curves for each good illustrate the relationship between the quantity consumed and income (on the vertical axis). Both Engel curves are upward sloping. C F income cons umpt ion curve I F