6 Biostatistics for Animal Science 1.4 Numerical Methods for Presenting Data Numerical methods for presenting data are often called descriptive statistics.They include: a)measures of central tendency;b)measures of variability;c)measures of the shape of a distribution:and d)measures of relative standing. Descriptive statistics c)measures of the a)measures of b)measures of d)measures of central tendency variability shape of a relative position distribution arithmetic mear -range -skewness percentiles -median variance -kurtosis -z-values -mode standard deviation coefficient of vanation Before descriptive statistics are explained in detail,it is useful to explain a system of symbolic notation that is used not only in descriptive statistics,but in statistics in general. This includes the symbols for the sum.sum of squares and sum of products. 1.4.1 Symbolic Notation The Greek letter >(sigma)is used as a symbol for summation,and y,for the value for The sum ofn numberscan be expressed: The sum of squares of n numbersy is: ,=+y++。 The sum of products of two sets of n numbers()and(v): w=x0+++ Example:Consider a set of three numbers:1,3 and 6.The numbers are symbolized by: 1=1.2=3and=6. The sum and sum of squares of those numbers are: ∑y=1+3+6=10
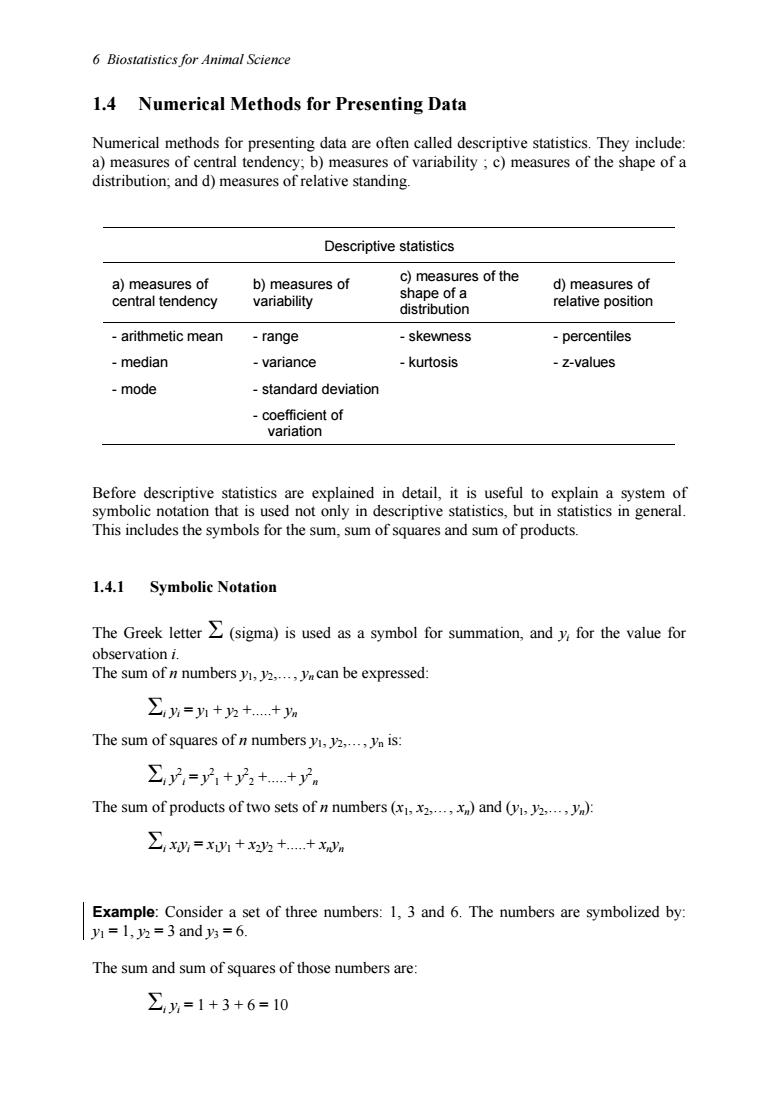
6 Biostatistics for Animal Science 1.4 Numerical Methods for Presenting Data Numerical methods for presenting data are often called descriptive statistics. They include: a) measures of central tendency; b) measures of variability ; c) measures of the shape of a distribution; and d) measures of relative standing. Descriptive statistics a) measures of central tendency b) measures of variability c) measures of the shape of a distribution d) measures of relative position - arithmetic mean - range - skewness - percentiles - median - variance - kurtosis - z-values - mode - standard deviation - coefficient of variation Before descriptive statistics are explained in detail, it is useful to explain a system of symbolic notation that is used not only in descriptive statistics, but in statistics in general. This includes the symbols for the sum, sum of squares and sum of products. 1.4.1 Symbolic Notation The Greek letter Σ (sigma) is used as a symbol for summation, and yi for the value for observation i. The sum of n numbers y1, y2,., yn can be expressed: Σi yi = y1 + y2 +.+ yn The sum of squares of n numbers y1, y2,., yn is: Σi y2 i = y 2 1 + y 2 2 +.+ y 2 n The sum of products of two sets of n numbers (x1, x2,., xn) and (y1, y2,., yn): Σi xiyi = x1y1 + x2y2 +.+ xnyn Example: Consider a set of three numbers: 1, 3 and 6. The numbers are symbolized by: y1 = 1, y2 = 3 and y3 = 6. The sum and sum of squares of those numbers are: Σi yi = 1 + 3 + 6 = 10
Chapter I Presenting and Summarizing Data 7 ∑2,=12+32+62=46 Consider another set of numbers:x1=2,x2=4 and x3=5. The sum of products ofx andy is: ∑,5=(12)+(3X4)+(65)=44 Three main rules of addition are: 1.The sum of addition of two sets of numbers is equal to the addition of the sums: ∑+W=∑x+∑y 2.The sum of products of a constant k and a variable y is equal to the product of the constant and the sum of the values of the variable: ∑k%=k∑5 3.The sum ofnconstants with value k is equal to the productnk ∑k=nk 1.4.2 Measures of Central Tendency Commonly used measures of central tendency are the arithmetic mean,median and mode The arithmetic mean of a sample of n numbers yy.y.is: y The arithmetic mean for grouped data is: with f being the frequency or proportion of observationsy Iffis a proportion thenn=1 Important properties of the arithmetic mean are: 1. ∑y,-)=0 the arith This means that only ndent e expres =-y- 2. ∑y-或=minimum The sum of squared deviations from the arithmetic mean is smaller than the sum of squared deviations from any other value
Chapter 1 Presenting and Summarizing Data 7 Σi y2 i = 12 + 32 + 62 = 46 Consider another set of numbers: x1 = 2, x2 = 4 and x3 = 5. The sum of products of x and y is: Σi xiyi = (1)(2) + (3)(4) + (6)(5) = 44 Three main rules of addition are: 1. The sum of addition of two sets of numbers is equal to the addition of the sums: Σi (xi + yi) = Σi xi + Σi yi 2. The sum of products of a constant k and a variable y is equal to the product of the constant and the sum of the values of the variable: Σi k yi = k Σi yi 3. The sum of n constants with value k is equal to the product n k: Σi k = n k 1.4.2 Measures of Central Tendency Commonly used measures of central tendency are the arithmetic mean, median and mode. The arithmetic mean of a sample of n numbers y1,y2,., yn is: n y y i ∑ i = The arithmetic mean for grouped data is: n f y y i ∑ i i = with fi being the frequency or proportion of observations yi. If fi is a proportion then n = 1. Important properties of the arithmetic mean are: 1. ∑ ( ) − = i i y y 0 The sum of deviation from the arithmetic mean is equal to zero. This means that only (n - 1) observations are independent and the n th can be expressed as 1 1 . n = − − − n− y ny y y 2. ∑ ( ) − = i i y y 2 minimum The sum of squared deviations from the arithmetic mean is smaller than the sum of squared deviations from any other value
8 Biostatistics for Animal Science The Me the mid of a sample or n observaonsyi the valu of the o servation that is in e when from sma est to the largest. he va e of ervation located such f of the area of a his s on the lef an half is on the If n is an odd numbe the me nan Is the servati on. -th andth observations. The Mode of a sample ofn the value among the observations that has the highest frequency. requency distributions illustrating the mear median and m symmetri median and ut the set of data.U 10 he me tha ency than the arithmetic mean.Fo median (balance point) Figure 1.4 Interpretation of mean,median and mode 1.4.3 Measures of Variability Commonly used measures of variability are the range,variance,standard deviation and coefficient of variation. Range is defined as the difference between the maximum and minimum values in a set of observations. Sample variance (s)of n observations(measurements)y.y.is: =∑-y n-1 This formula is valid if is calculated from the same sample,i.e.the mean of a population is not known.If the mean of a population (is known then the variance is: ∑-w n
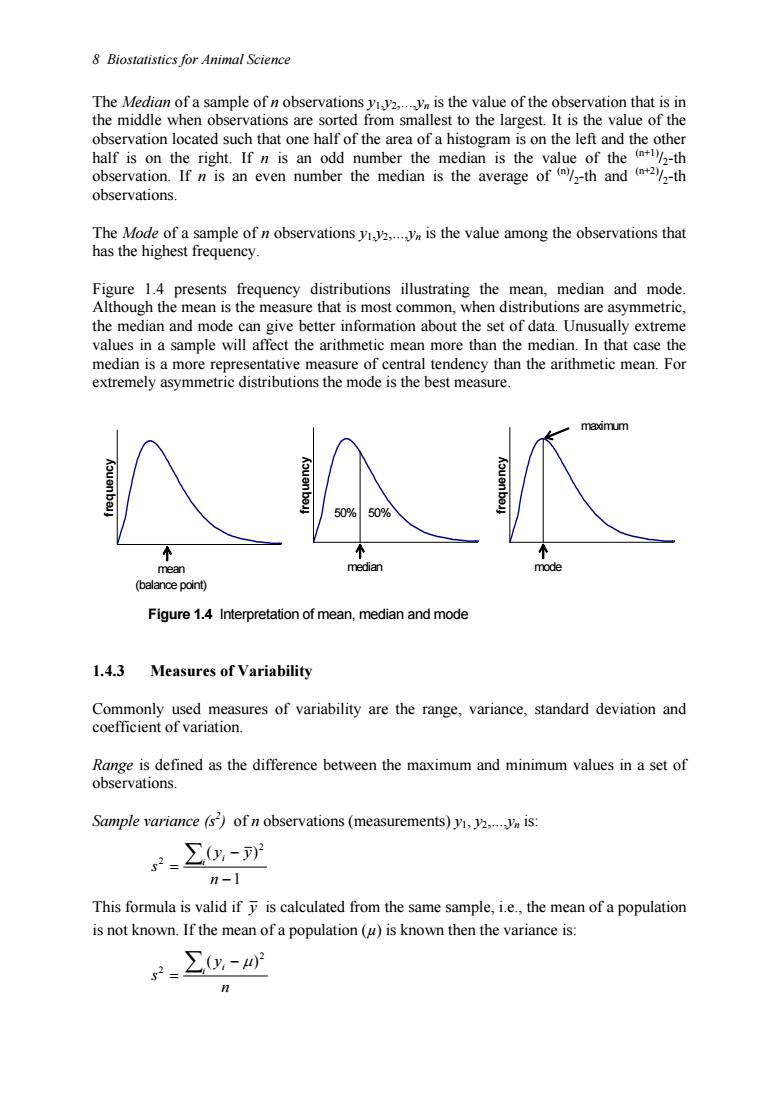
8 Biostatistics for Animal Science The Median of a sample of n observations y1,y2,.,yn is the value of the observation that is in the middle when observations are sorted from smallest to the largest. It is the value of the observation located such that one half of the area of a histogram is on the left and the other half is on the right. If n is an odd number the median is the value of the (n+1)/2-th observation. If n is an even number the median is the average of (n)/2-th and (n+2)/2-th observations. The Mode of a sample of n observations y1,y2,.,yn is the value among the observations that has the highest frequency. Figure 1.4 presents frequency distributions illustrating the mean, median and mode. Although the mean is the measure that is most common, when distributions are asymmetric, the median and mode can give better information about the set of data. Unusually extreme values in a sample will affect the arithmetic mean more than the median. In that case the median is a more representative measure of central tendency than the arithmetic mean. For extremely asymmetric distributions the mode is the best measure. frequency mean (balance point) frequency median 50% 50% frequency mode maximum Figure 1.4 Interpretation of mean, median and mode 1.4.3 Measures of Variability Commonly used measures of variability are the range, variance, standard deviation and coefficient of variation. Range is defined as the difference between the maximum and minimum values in a set of observations. Sample variance (s2 ) of n observations (measurements) y1, y2,.,yn is: 1 ( ) 2 2 − − = ∑ n y y s i i This formula is valid if y is calculated from the same sample, i.e., the mean of a population is not known. If the mean of a population (µ) is known then the variance is: n y s i ∑ i − = 2 2 ( µ)
Chapter I Presenting and Summarizing Data 9 The variance is the average squared deviation about the mean. The sum of squared deviations about the arithmetic mean is often called the corrected sum of squares or just sum of squares and it is denoted by SS.The corrected sum of squares can be calculated: 。r-∑② n Further,the sample variance is often called the mean square denoted by MS because For grouped data,the sample variance with an unknown population mean is: g.∑0- n-1 where is the frequency of observation and the total number of observations is= mple standard deviation (s)is eqal to square root of the variance.It is the averag mean: s=月 Coefficient of variation(CV)is defined as CY=100% The coefficient of variation is a relative measure of variability expressed as a percentage.It is often easier to understand the importance of variability if it is expressed as a percentage This is especially true when variability is compared among sets of data that have different units.For example if CV for weight and height are 40%and 20%,respectively,we can conclude that weight is more variable than height. 1.4.4 Measures of the Shape of a Distribution The measures of the shape of a distribution are the coefficients of skewness and kurtosis. Skewness (sk)is a measure of asymmetry of a frequency distribution.It shows if deviations from the mean are larger on one side than the other side of the distribution.If the population mean (u)is known.then skewness is: *-G-G-3
Chapter 1 Presenting and Summarizing Data 9 The variance is the average squared deviation about the mean. The sum of squared deviations about the arithmetic mean is often called the corrected sum of squares or just sum of squares and it is denoted by SSyy. The corrected sum of squares can be calculated: ( ) n y SS y y y i i i i i yy i 2 2 2 ( ) ∑ = ∑ − = ∑ − Further, the sample variance is often called the mean square denoted by MSyy, because: 1 2 − = = n SS s MS yy yy For grouped data, the sample variance with an unknown population mean is: 1 ( ) 2 2 − − = ∑ n f y y s i i i where fi is the frequency of observation yi, and the total number of observations is n = Σifi. Sample standard deviation (s) is equal to square root of the variance. It is the average absolute deviation from the mean: 2 s = s Coefficient of variation (CV) is defined as: 100% y s CV = The coefficient of variation is a relative measure of variability expressed as a percentage. It is often easier to understand the importance of variability if it is expressed as a percentage. This is especially true when variability is compared among sets of data that have different units. For example if CV for weight and height are 40% and 20%, respectively, we can conclude that weight is more variable than height. 1.4.4 Measures of the Shape of a Distribution The measures of the shape of a distribution are the coefficients of skewness and kurtosis. Skewness (sk) is a measure of asymmetry of a frequency distribution. It shows if deviations from the mean are larger on one side than the other side of the distribution. If the population mean (µ) is known, then skewness is: ( )( )∑ − − − = i i s y n n sk 3 1 2 1 µ
10 Biostatistics for Animal Science If the population mean is unknown,the sample mean()is substituted for u and skewness is: *a-可2到 For a symmetric distribution skewness is equal to zero.It is positive when the right tail is longer,and negative when left tail is longer(Figure 1.5). a) b) Figure 1.5 llustrations of skewness:a)negative,b)positive Kurtosis (kt)is a measure of flatness or steepness of a distribution,or a measure of the heaviness of the tails of a distribution.If the population mean (is known,kurtosis is: If the population mean is unknown,the sample mean()is used instead and kurtosis is: -222 nn+1) 3n-1下 For variables such as weight,height or milk yield,frequency distributions are expected to be symmetric about the mean and bell-shaped.These are normal distributions.If observations follow a normal distribution then kurtosis is equal to zero.A distribution with positive kurtosis has a large frequency of observations close to the mean and thin tails.A distribution with a negative kurtosis has thicker tails and a lower frequency of observations close to the mean than does the normal distribution(Figure 1.6). a) Figure 1.6 llustrations of kurtosis:a)positive,b)negative
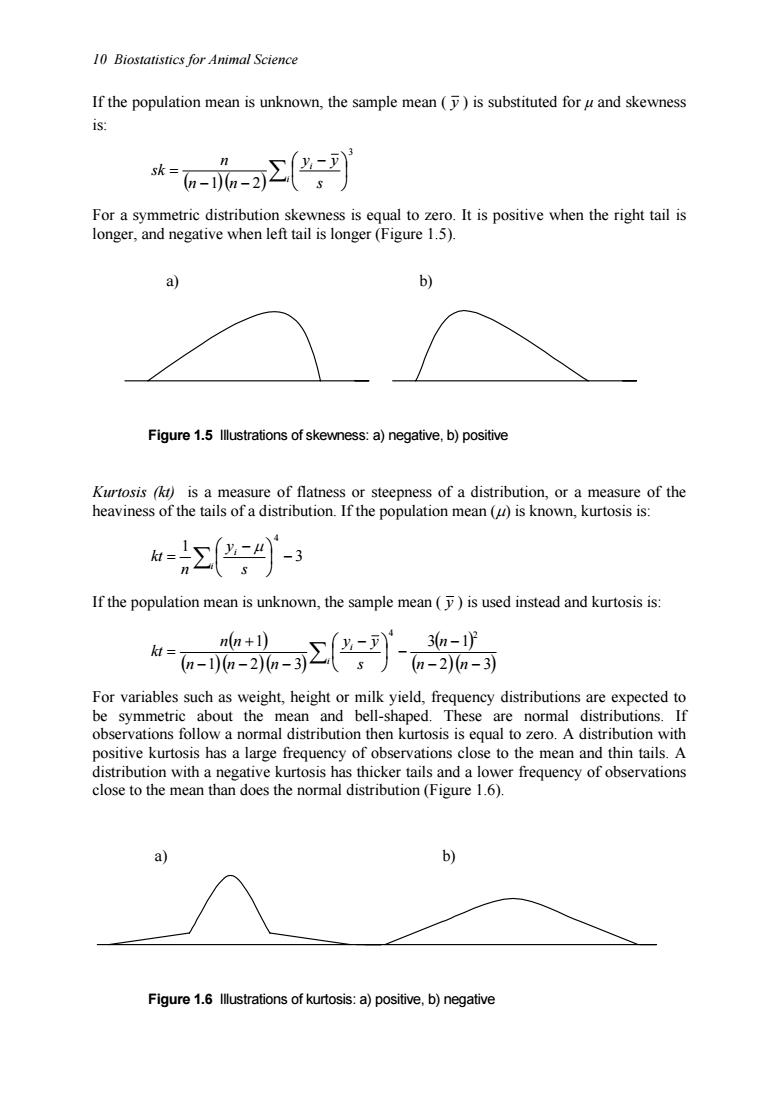
10 Biostatistics for Animal Science If the population mean is unknown, the sample mean ( y ) is substituted for µ and skewness is: ( )( )∑ − − − = i i s y y n n n sk 3 1 2 For a symmetric distribution skewness is equal to zero. It is positive when the right tail is longer, and negative when left tail is longer (Figure 1.5). a) b) Figure 1.5 Illustrations of skewness: a) negative, b) positive Kurtosis (kt) is a measure of flatness or steepness of a distribution, or a measure of the heaviness of the tails of a distribution. If the population mean (µ) is known, kurtosis is: 3 1 4 − − = ∑i i s y n kt µ If the population mean is unknown, the sample mean ( y ) is used instead and kurtosis is: ( ) ( )( )( ) ( ) ( )( ) 2 3 3 1 1 2 3 1 4 2 − − − − − − − − + = ∑ n n n s y y n n n n n kt i i For variables such as weight, height or milk yield, frequency distributions are expected to be symmetric about the mean and bell-shaped. These are normal distributions. If observations follow a normal distribution then kurtosis is equal to zero. A distribution with positive kurtosis has a large frequency of observations close to the mean and thin tails. A distribution with a negative kurtosis has thicker tails and a lower frequency of observations close to the mean than does the normal distribution (Figure 1.6). a) b) Figure 1.6 Illustrations of kurtosis: a) positive, b) negative