Statistical Learning Theory and Applications Lecture 3 Regression Models Instructor:Quan Wen SCSE@UESTC Fall 2021
Statistical Learning Theory and Applications Lecture 3 Regression Models Instructor: Quan Wen SCSE@UESTC Fall 2021
Outline (Level 1) ①A Case 2 Least Squares Method 3 From Linear to Nonlinear:Using Linear Model 4How Regression Got Its Name 5】 Probability Interpretation 6 Bias-Variance Dilemma 1178
Outline (Level 1) 1 A Case 2 Least Squares Method 3 From Linear to Nonlinear: Using Linear Model 4 How Regression Got Its Name 5 Probability Interpretation 6 Bias–Variance Dilemma 1 / 78
Topics: Basic theoretical concepts,properties,calculations of regression analysis Derivation and calculation of least squares o Probability interpretation of regression analysis o Regression analysis of nonlinear functions o Bias-variance dilemma of regression analysis Key points and difficulties: Key points:Derivation and calculation of least squares o Difficulties:Probability interpretation of regression analysis 2/78
Topics: Basic theoretical concepts, properties, calculations of regression analysis Derivation and calculation of least squares Probability interpretation of regression analysis Regression analysis of nonlinear functions Bias-variance dilemma of regression analysis Key points and difficulties: Key points: Derivation and calculation of least squares Difficulties: Probability interpretation of regression analysis 2 / 78
Outline (Level 1) A Case Least Squares Method From Linear to Nonlinear:Using Linear Model How Regression Got Its Name Probability Interpretation Bias-Variance Dilemma 3/78
Outline (Level 1) 1 A Case 2 Least Squares Method 3 From Linear to Nonlinear: Using Linear Model 4 How Regression Got Its Name 5 Probability Interpretation 6 Bias–Variance Dilemma 3 / 78
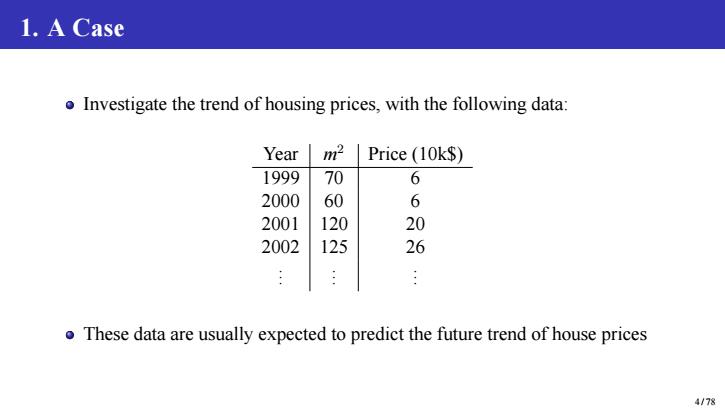
1.A Case o Investigate the trend of housing prices,with the following data: Year m2 Price (10k$) 1999 70 6 2000 60 6 2001 120 20 2002 125 26 o These data are usually expected to predict the future trend of house prices 4/78
1. A Case Investigate the trend of housing prices, with the following data: Year m 2 Price (10k$) 1999 70 6 2000 60 6 2001 120 20 2002 125 26 . . . . . . . . . These data are usually expected to predict the future trend of house prices 4 / 78