Plotting (11/43) a形 property of the line plot(x,y,'the property') √eg x=0:1:10; y=x.2-10.*x+15; plot(xy,'r--',x,y,'bo'); 10 @日济大学 TONGJI UNIVERSITY
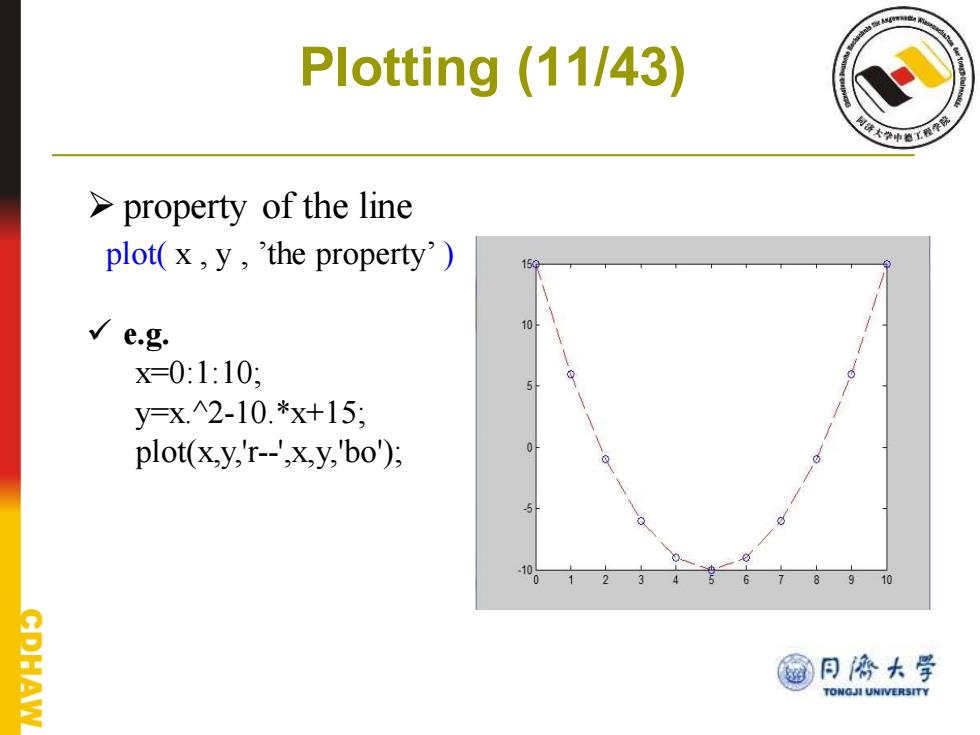
Plotting (11/43) ➢ property of the line plot( x , y , ’the property’ ) ✓ e.g. x=0:1:10; y=x.^2-10.*x+15; plot(x,y,'r--',x,y,'bo');
Plotting (12/43) line color line marker line style b blue point solid g green 0 circle dotted r red 十 x-mark dashdot cyan + plus dashed m magenta star y yellow square k black d diamond V triangle(down) triangle(up) triangle(left) triangle(right) p pentagram CDHAW h hexagram @大学 TONGJI UNIVERSITY
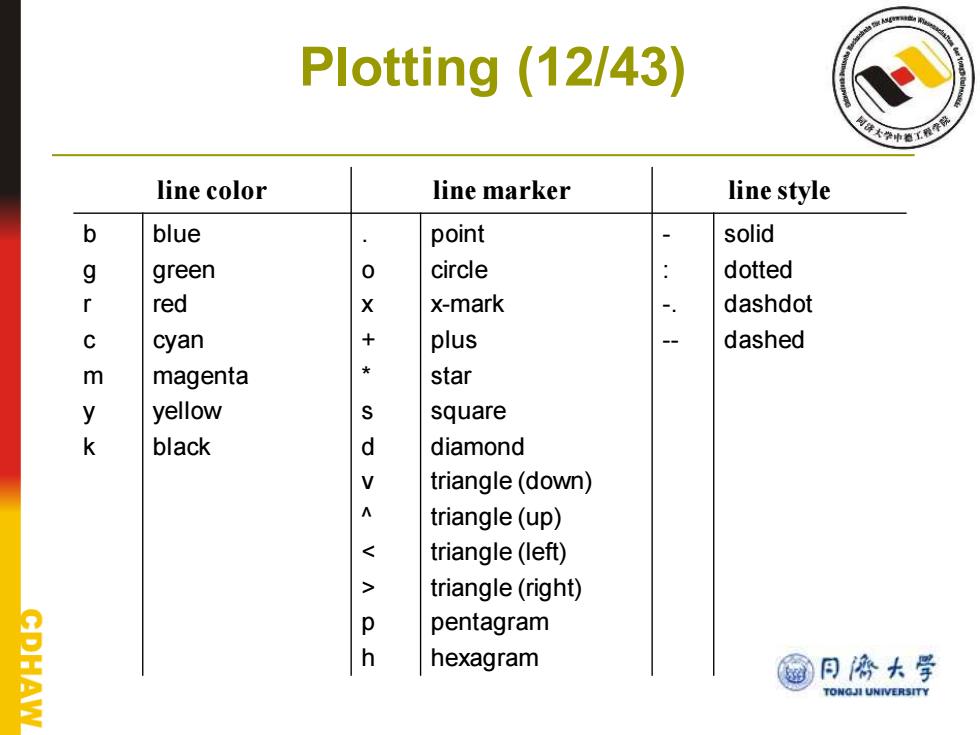
Plotting (12/43) line color line marker line style b g r c m y k blue green red cyan magenta yellow black . o x + * s d v ^ < > p h point circle x-mark plus star square diamond triangle (down) triangle (up) triangle (left) triangle (right) pentagram hexagram - : -. -- solid dotted dashdot dashed
Plotting (13/43) Plot of f(x)=sin(2x)and its derivative f(x) d/dx f(x) e.g. x=0pi/100:2*pi; y1=sin(2*x); y2=2*cos(2*X); plot(x,y1,'k-',x,y2,'b--); title('Plot of f(x)=sin(2x)and its derivative'); xlabel('x); ylabel(y); 3 legend("f(x)','d/dx f(x)); grid on; @日济大学 AW TONGJI UNIVERSITY
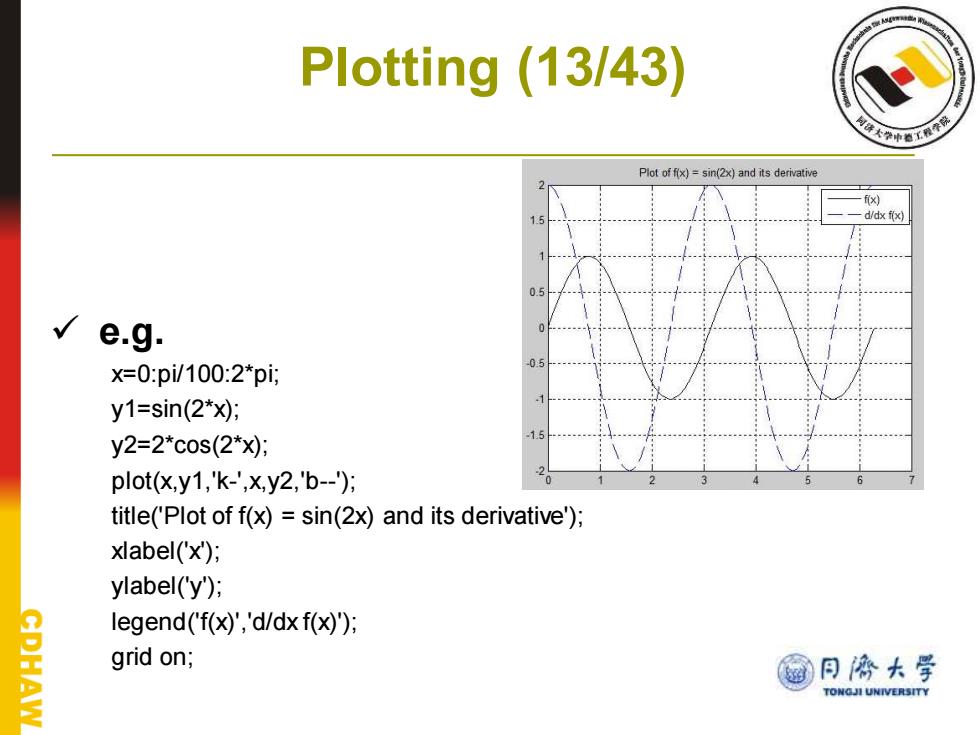
Plotting (13/43) ✓ e.g. x=0:pi/100:2*pi; y1=sin(2*x); y2=2*cos(2*x); plot(x,y1,'k-',x,y2,'b--'); title('Plot of f(x) = sin(2x) and its derivative'); xlabel('x'); ylabel('y'); legend('f(x)','d/dx f(x)'); grid on;
Plotting (14/43) >Logarithmic Plots plot both x and y data on linear axes √semilogx x:logarithmic axes y:linear axes √semilogy y:logarithmic axes x:linear axes √loglog x:logarithmic axes y:logarithmic axes CDHAW 细月济大学 TONGJI UNIVERSITY
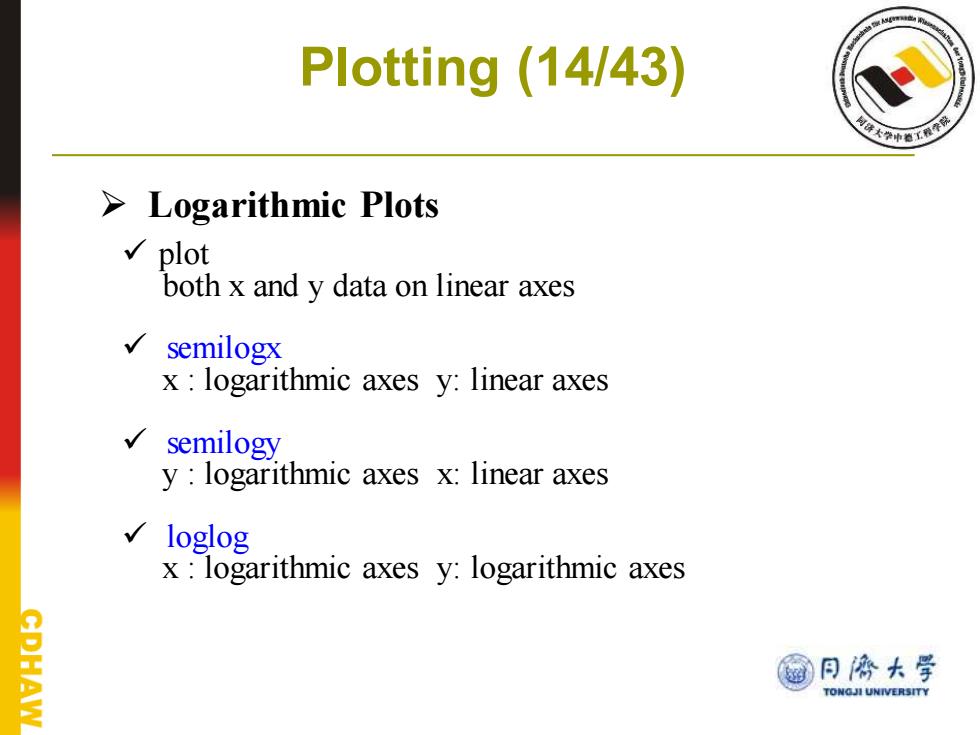
Plotting (14/43) ➢ Logarithmic Plots ✓ plot both x and y data on linear axes ✓ semilogx x : logarithmic axes y: linear axes ✓ semilogy y : logarithmic axes x: linear axes ✓ loglog x : logarithmic axes y: logarithmic axes
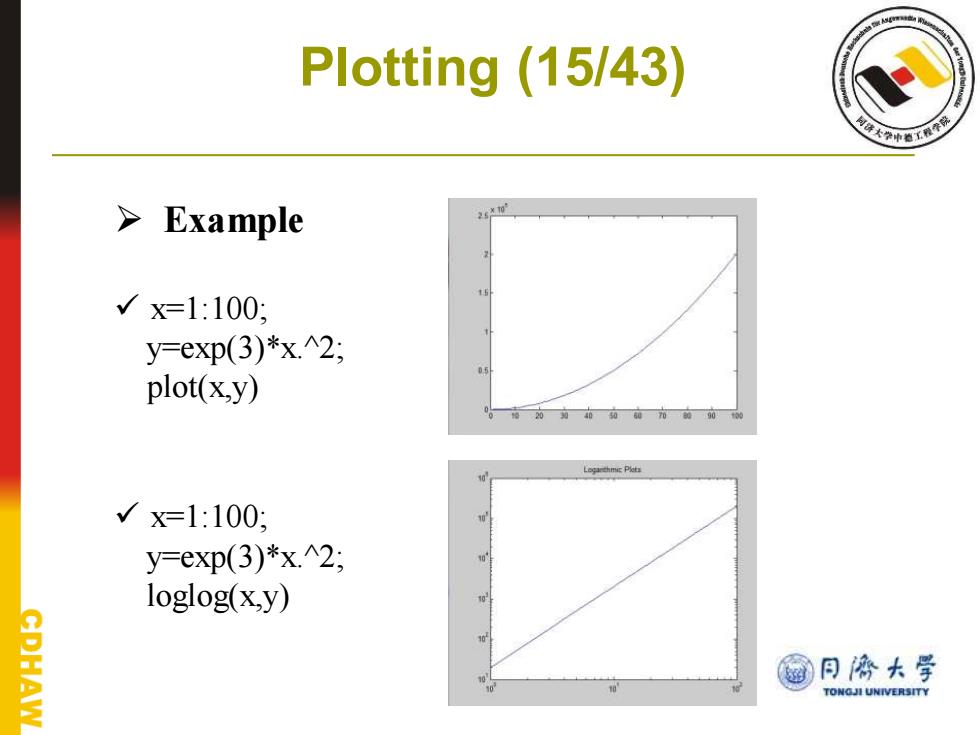
Plotting (15/43) a形 > Example 10 √x=1:100; y=exp(3)*x.^2; plot(x,y) /x=1:100; y=exp(3)*x.2; loglog(x,y) PHAW @日济大学 TONGJI UNIVERSITY
Plotting (15/43) ➢ Example ✓ x=1:100; y=exp(3)*x.^2; plot(x,y) ✓ x=1:100; y=exp(3)*x.^2; loglog(x,y)