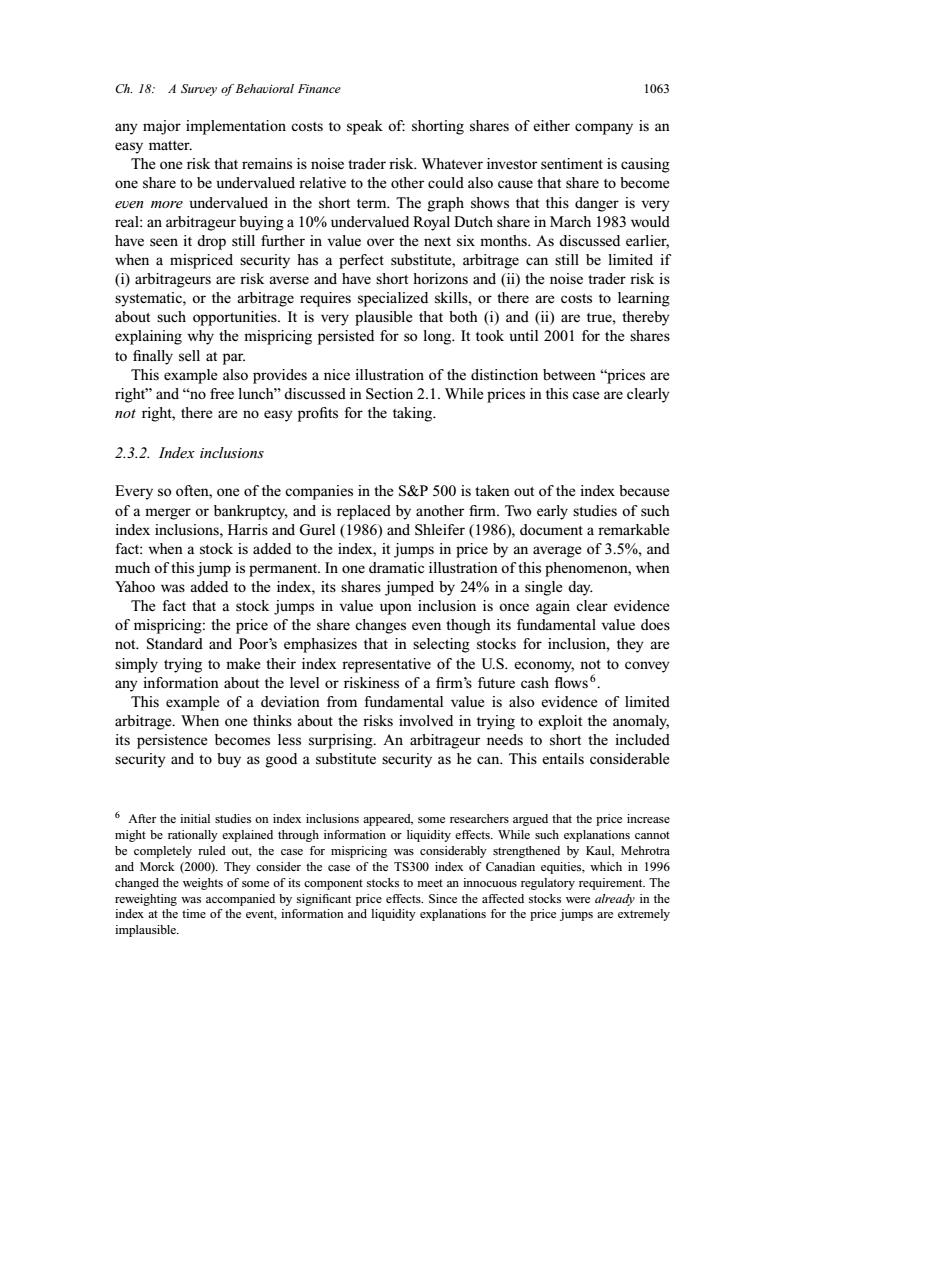
Ch.18:A Survey of Behavioral Finance 1063 any major implementation costs to speak of:shorting shares of either company is an easy matter. The one risk that remains is noise trader risk.Whatever investor sentiment is causing one share to be undervalued relative to the other could also cause that share to become even more undervalued in the short term.The graph shows that this danger is very real:an arbitrageur buying a 10%undervalued Royal Dutch share in March 1983 would have seen it drop still further in value over the next six months.As discussed earlier, when a mispriced security has a perfect substitute,arbitrage can still be limited if (i)arbitrageurs are risk averse and have short horizons and (ii)the noise trader risk is systematic,or the arbitrage requires specialized skills,or there are costs to learning about such opportunities.It is very plausible that both (i)and(ii)are true,thereby explaining why the mispricing persisted for so long.It took until 2001 for the shares to finally sell at par. This example also provides a nice illustration of the distinction between"prices are right"and"no free lunch"discussed in Section 2.1.While prices in this case are clearly not right,there are no easy profits for the taking. 2.3.2.Index inclusions Every so often,one of the companies in the S&P 500 is taken out of the index because of a merger or bankruptcy,and is replaced by another firm.Two early studies of such index inclusions,Harris and Gurel (1986)and Shleifer(1986).document a remarkable fact:when a stock is added to the index,it jumps in price by an average of 3.5%,and much of this jump is permanent.In one dramatic illustration of this phenomenon,when Yahoo was added to the index,its shares jumped by 24%in a single day. The fact that a stock jumps in value upon inclusion is once again clear evidence of mispricing:the price of the share changes even though its fundamental value does not.Standard and Poor's emphasizes that in selecting stocks for inclusion,they are simply trying to make their index representative of the U.S.economy,not to convey any information about the level or riskiness of a firm's future cash flowso This example of a deviation from fundamental value is also evidence of limited arbitrage.When one thinks about the risks involved in trying to exploit the anomaly, its persistence becomes less surprising.An arbitrageur needs to short the included security and to buy as good a substitute security as he can.This entails considerable 6 After the initial studies on index inclusions appeared,some researchers argued that the price increase might be rationally explained through information or liquidity effects.While such explanations cannot be completely ruled out,the case for mispricing was considerably strengthened by Kaul,Mehrotra and Morck(2000).They consider the case of the TS300 index of Canadian equities,which in 1996 changed the weights of some of its component stocks to meet an innocuous regulatory requirement.The reweighting was accompanied by significant price effects.Since the affected stocks were already in the index at the time of the event,information and liquidity explanations for the price jumps are extremely implausible
Ch. 18: A Survey of Behavioral Finance 1063 any major implementation costs to speak of: shorting shares of either company is an easy matter. The one risk that remains is noise trader risk. Whatever investor sentiment is causing one share to be undervalued relative to the other could also cause that share to become even more undervalued in the short term. The graph shows that this danger is very real: an arbitrageur buying a 10% undervalued Royal Dutch share in March 1983 would have seen it drop still further in value over the next six months. As discussed earlier, when a mispriced security has a perfect substitute, arbitrage can still be limited if (i) arbitrageurs are risk averse and have short horizons and (ii) the noise trader risk is systematic, or the arbitrage requires specialized skills, or there are costs to learning about such opportunities. It is very plausible that both (i) and (ii) are true, thereby explaining why the mispricing persisted for so long. It took until 2001 for the shares to finally sell at par. This example also provides a nice illustration of the distinction between “prices are right” and “no free lunch” discussed in Section 2.1. While prices in this case are clearly not right, there are no easy profits for the taking. 2.3.2. Index inclusions Every so often, one of the companies in the S&P 500 is taken out of the index because of a merger or bankruptcy, and is replaced by another firm. Two early studies of such index inclusions, Harris and Gurel (1986) and Shleifer (1986), document a remarkable fact: when a stock is added to the index, it jumps in price by an average of 3.5%, and much of this jump is permanent. In one dramatic illustration of this phenomenon, when Yahoo was added to the index, its shares jumped by 24% in a single day. The fact that a stock jumps in value upon inclusion is once again clear evidence of mispricing: the price of the share changes even though its fundamental value does not. Standard and Poor’s emphasizes that in selecting stocks for inclusion, they are simply trying to make their index representative of the U.S. economy, not to convey any information about the level or riskiness of a firm’s future cash flows 6. This example of a deviation from fundamental value is also evidence of limited arbitrage. When one thinks about the risks involved in trying to exploit the anomaly, its persistence becomes less surprising. An arbitrageur needs to short the included security and to buy as good a substitute security as he can. This entails considerable 6 After the initial studies on index inclusions appeared, some researchers argued that the price increase might be rationally explained through information or liquidity effects. While such explanations cannot be completely ruled out, the case for mispricing was considerably strengthened by Kaul, Mehrotra and Morck (2000). They consider the case of the TS300 index of Canadian equities, which in 1996 changed the weights of some of its component stocks to meet an innocuous regulatory requirement. The reweighting was accompanied by significant price effects. Since the affected stocks were already in the index at the time of the event, information and liquidity explanations for the price jumps are extremely implausible
1064 N.Barberis and R.Thaler fundamental risk because individual stocks rarely have good substitutes.It also carries substantial noise trader risk:whatever caused the initial jump in price-in all likelihood,buying by S&P 500 index funds-may continue,and cause the price to rise still further in the short run;indeed,Yahoo went from $115 prior to its S&P inclusion announcement to $210 a month later. Wurgler and Zhuravskaya(2002)provide additional support for the limited arbitrage view of S&P 500 inclusions.They hypothesize that the jump upon inclusion should be particularly large for those stocks with the worst substitute securities,in other words, for those stocks for which the arbitrage is riskiest.By constructing the best possible substitute portfolio for each included stock,they are able to test this,and find strong support.Their analysis also shows just how hard it is to find good substitute securities for individual stocks.For most regressions of included stock returns on the returns of the best substitute securities,the R2 is below 25%. 2.3.3.Internet carve-outs In March 2000.3Com sold 5%of its wholly owned subsidiary Palm Inc.in an initial public offering,retaining ownership of the remaining 95%.After the IPO,a shareholder of 3Com indirectly owned 1.5 shares of Palm.3Com also announced its intention to spin off the remainder of Palm within 9 months,at which time they would give each 3Com shareholder 1.5 shares of Palm. At the close of trading on the first day after the IPO,Palm shares stood at $95, putting a lower bound on the value of 3Com at $142.In fact,3Com's price was $81, implying a market valuation of 3Com's substantial businesses outside of Palm of about -$60 per share! This situation surely represents a severe mispricing,and it persisted for several weeks.To exploit it,an arbitrageur could buy one share of 3Com,short 1.5 shares of Palm,and wait for the spin-off,thus earning certain profits at no cost.This strategy entails no fundamental risk and no noise trader risk.Why,then,is arbitrage limited? Lamont and Thaler(2003),who analyze this case in detail,argue that implementation costs played a major role.Many investors who tried to borrow Palm shares to short were either told by their broker that no shares were available,or else were quoted a very high borrowing price.This barrier to shorting was not a legal one,but one that arose endogenously in the marketplace:such was the demand for shorting Palm,that the supply of Palm shorts was unable to meet it.Arbitrage was therefore limited,and the mispricing persisted7. Some financial economists react to these examples by arguing that they are simply isolated instances with little broad relevance8.We think this is an overly complacent 7 See also Mitchell,Pulvino and Stafford(2002)and Ofek and Richardson(2003)for further discussion of such "negative stub"situations,in which the market value of a company is less than the sum of its publicly traded parts. During a discussion of these issues at a University of Chicago seminar.one economist argued that these examples are "the tip of the iceberg",to which another retorted that "they are the iceberg
1064 N. Barberis and R. Thaler fundamental risk because individual stocks rarely have good substitutes. It also carries substantial noise trader risk: whatever caused the initial jump in price – in all likelihood, buying by S&P 500 index funds – may continue, and cause the price to rise still further in the short run; indeed, Yahoo went from $115 prior to its S&P inclusion announcement to $210 a month later. Wurgler and Zhuravskaya (2002) provide additional support for the limited arbitrage view of S&P 500 inclusions. They hypothesize that the jump upon inclusion should be particularly large for those stocks with the worst substitute securities, in other words, for those stocks for which the arbitrage is riskiest. By constructing the best possible substitute portfolio for each included stock, they are able to test this, and find strong support. Their analysis also shows just how hard it is to find good substitute securities for individual stocks. For most regressions of included stock returns on the returns of the best substitute securities, the R2 is below 25%. 2.3.3. Internet carve-outs In March 2000, 3Com sold 5% of its wholly owned subsidiary Palm Inc. in an initial public offering, retaining ownership of the remaining 95%. After the IPO, a shareholder of 3Com indirectly owned 1.5 shares of Palm. 3Com also announced its intention to spin off the remainder of Palm within 9 months, at which time they would give each 3Com shareholder 1.5 shares of Palm. At the close of trading on the first day after the IPO, Palm shares stood at $95, putting a lower bound on the value of 3Com at $142. In fact, 3Com’s price was $81, implying a market valuation of 3Com’s substantial businesses outside of Palm of about −$60 per share! This situation surely represents a severe mispricing, and it persisted for several weeks. To exploit it, an arbitrageur could buy one share of 3Com, short 1.5 shares of Palm, and wait for the spin-off, thus earning certain profits at no cost. This strategy entails no fundamental risk and no noise trader risk. Why, then, is arbitrage limited? Lamont and Thaler (2003), who analyze this case in detail, argue that implementation costs played a major role. Many investors who tried to borrow Palm shares to short were either told by their broker that no shares were available, or else were quoted a very high borrowing price. This barrier to shorting was not a legal one, but one that arose endogenously in the marketplace: such was the demand for shorting Palm, that the supply of Palm shorts was unable to meet it. Arbitrage was therefore limited, and the mispricing persisted 7. Some financial economists react to these examples by arguing that they are simply isolated instances with little broad relevance 8. We think this is an overly complacent 7 See also Mitchell, Pulvino and Stafford (2002) and Ofek and Richardson (2003) for further discussion of such “negative stub” situations, in which the market value of a company is less than the sum of its publicly traded parts. 8 During a discussion of these issues at a University of Chicago seminar, one economist argued that these examples are “the tip of the iceberg”, to which another retorted that “they are the iceberg
Ch.18:A Survey of Behavioral Finance 1065 view.The "twin shares"example illustrates that in situations where arbitrageurs face only one type of risk-noise trader risk-securities can become mispriced by almost 35%.This suggests that if a typical stock trading on the NYSE or NASDAQ becomes subject to investor sentiment,the mispricing could be an order of magnitude larger.Not only would arbitrageurs face noise trader risk in trying to correct the mispricing,but fundamental risk as well,not to mention implementation costs. 3.Psychology The theory of limited arbitrage shows that if irrational traders cause deviations from fundamental value,rational traders will often be powerless to do anything about it. In order to say more about the structure of these deviations,behavioral models often assume a specific form of irrationality.For guidance on this,economists turn to the extensive experimental evidence compiled by cognitive psychologists on the systematic biases that arise when people form beliefs,and on people's preferences. In this section,we summarize the psychology that may be of particular interest to financial economists.Our discussion of each finding is necessarily brief.For a deeper understanding of the phenomena we touch on,we refer the reader to the surveys of Camerer(1995)and Rabin(1998)and to the edited volumes of Kahneman,Slovic and Tversky(1982),Kahneman and Tversky(2000)and Gilovich,Griffin and Kahneman (2002) 3.1.Beliefs A crucial component of any model of financial markets is a specification of how agents form expectations.We now summarize what psychologists have learned about how people appear to form beliefs in practice. Overconfidence.Extensive evidence shows that people are overconfident in their judgments.This appears in two guises.First,the confidence intervals people assign to their estimates of quantities-the level of the Dow in a year,say-are far too narrow.Their 98%confidence intervals,for example,include the true quantity only about 60%of the time [Alpert and Raiffa(1982)].Second,people are poorly calibrated when estimating probabilities:events they think are certain to occur actually occur only We emphasize,however,that behavioral models do not need to make extensive psychological assumptions in order to generate testable predictions.In Section 6,we discuss Lee,Shleifer and Thaler's (1991)theory of closed-end fund pricing.That theory makes numerous crisp predictions using only the assumptions that there are noise traders with correlated sentiment in the economy,and that arbitrage is limited
Ch. 18: A Survey of Behavioral Finance 1065 view. The “twin shares” example illustrates that in situations where arbitrageurs face only one type of risk – noise trader risk – securities can become mispriced by almost 35%. This suggests that if a typical stock trading on the NYSE or NASDAQ becomes subject to investor sentiment, the mispricing could be an order of magnitude larger. Not only would arbitrageurs face noise trader risk in trying to correct the mispricing, but fundamental risk as well, not to mention implementation costs. 3. Psychology The theory of limited arbitrage shows that if irrational traders cause deviations from fundamental value, rational traders will often be powerless to do anything about it. In order to say more about the structure of these deviations, behavioral models often assume a specific form of irrationality. For guidance on this, economists turn to the extensive experimental evidence compiled by cognitive psychologists on the systematic biases that arise when people form beliefs, and on people’s preferences 9. In this section, we summarize the psychology that may be of particular interest to financial economists. Our discussion of each finding is necessarily brief. For a deeper understanding of the phenomena we touch on, we refer the reader to the surveys of Camerer (1995) and Rabin (1998) and to the edited volumes of Kahneman, Slovic and Tversky (1982), Kahneman and Tversky (2000) and Gilovich, Griffin and Kahneman (2002). 3.1. Beliefs A crucial component of any model of financial markets is a specification of how agents form expectations. We now summarize what psychologists have learned about how people appear to form beliefs in practice. Overconfidence. Extensive evidence shows that people are overconfident in their judgments. This appears in two guises. First, the confidence intervals people assign to their estimates of quantities – the level of the Dow in a year, say – are far too narrow. Their 98% confidence intervals, for example, include the true quantity only about 60% of the time [Alpert and Raiffa (1982)]. Second, people are poorly calibrated when estimating probabilities: events they think are certain to occur actually occur only 9 We emphasize, however, that behavioral models do not need to make extensive psychological assumptions in order to generate testable predictions. In Section 6, we discuss Lee, Shleifer and Thaler’s (1991) theory of closed-end fund pricing. That theory makes numerous crisp predictions using only the assumptions that there are noise traders with correlated sentiment in the economy, and that arbitrage is limited
1066 N.Barberis and R.Thaler around 80%of the time,and events they deem impossible occur approximately 20% of the time [Fischhoff,Slovic and Lichtenstein (1977)]10 Optimism and wishful thinking.Most people display unrealistically rosy views of their abilities and prospects [Weinstein(1980)].Typically,over 90%of those surveyed think they are above average in such domains as driving skill,ability to get along with people and sense of humor.They also display a systematic planning fallacy:they predict that tasks(such as writing survey papers)will be completed much sooner than they actually are [Buehler,Griffin and Ross (1994)]. Representativeness.Kahneman and Tversky (1974)show that when people try to determine the probability that a data set A was generated by a model B,or that an object A belongs to a class B,they often use the representativeness heuristic.This means that they evaluate the probability by the degree to which A reflects the essential characteristics of B. Much of the time,representativeness is a helpful heuristic,but it can generate some severe biases.The first is base rate neglect.To illustrate,Kahneman and Tversky present this description of a person named Linda: Linda is 31 years old,single,outspoken,and very bright.She majored in philosophy. As a student,she was deeply concerned with issues of discrimination and social justice, and also participated in anti-nuclear demonstrations. When asked which of "Linda is a bank teller"(statement A)and "Linda is a bank teller and is active in the feminist movement"(statement B)is more likely, subjects typically assign greater probability to B.This is,of course,impossible. Representativeness provides a simple explanation.The description of Linda sounds like the description of a feminist-it is representative of a feminist-leading subjects to pick B.Put differently,while Bayes law says that p(statement B description)-p(description statement B)p(statement B) p(description) people apply the law incorrectly,putting too much weight on p(description statement B),which captures representativeness,and too little weight on the base rate, p(statement B). 10 Overconfidence may in part stem from two other biases,self-attribution bias and hindsight bias. Self-attribution bias refers to people's tendency to ascribe any success they have in some activity to their own talents,while blaming failure on bad luck,rather than on their ineptitude.Doing this repeatedly will lead people to the pleasing but erroneous conclusion that they are very talented.For example,investors might become overconfident after several quarters of investing success [Gervais and Odean(2001)]. Hindsight bias is the tendency of people to believe,after an event has occurred,that they predicted it before it happened.If people think they predicted the past better than they actually did,they may also believe that they can predict the future better than they actually can
1066 N. Barberis and R. Thaler around 80% of the time, and events they deem impossible occur approximately 20% of the time [Fischhoff, Slovic and Lichtenstein (1977)] 10. Optimism and wishful thinking. Most people display unrealistically rosy views of their abilities and prospects [Weinstein (1980)]. Typically, over 90% of those surveyed think they are above average in such domains as driving skill, ability to get along with people and sense of humor. They also display a systematic planning fallacy: they predict that tasks (such as writing survey papers) will be completed much sooner than they actually are [Buehler, Griffin and Ross (1994)]. Representativeness. Kahneman and Tversky (1974) show that when people try to determine the probability that a data set A was generated by a model B, or that an object A belongs to a class B, they often use the representativeness heuristic. This means that they evaluate the probability by the degree to which A reflects the essential characteristics of B. Much of the time, representativeness is a helpful heuristic, but it can generate some severe biases. The first is base rate neglect. To illustrate, Kahneman and Tversky present this description of a person named Linda: Linda is 31 years old, single, outspoken, and very bright. She majored in philosophy. As a student, she was deeply concerned with issues of discrimination and social justice, and also participated in anti-nuclear demonstrations. When asked which of “Linda is a bank teller” (statement A) and “Linda is a bank teller and is active in the feminist movement” (statement B) is more likely, subjects typically assign greater probability to B. This is, of course, impossible. Representativeness provides a simple explanation. The description of Linda sounds like the description of a feminist – it is representative of a feminist – leading subjects to pick B. Put differently, while Bayes law says that p (statement B | description) = p (description | statement B) p (statement B) p (description) , people apply the law incorrectly, putting too much weight on p(description | statement B), which captures representativeness, and too little weight on the base rate, p(statement B). 10 Overconfidence may in part stem from two other biases, self-attribution bias and hindsight bias. Self-attribution bias refers to people’s tendency to ascribe any success they have in some activity to their own talents, while blaming failure on bad luck, rather than on their ineptitude. Doing this repeatedly will lead people to the pleasing but erroneous conclusion that they are very talented. For example, investors might become overconfident after several quarters of investing success [Gervais and Odean (2001)]. Hindsight bias is the tendency of people to believe, after an event has occurred, that they predicted it before it happened. If people think they predicted the past better than they actually did, they may also believe that they can predict the future better than they actually can
Ch.18:A Survey of Behavioral Finance 1067 Representativeness also leads to another bias,sample size neglect.When judging the likelihood that a data set was generated by a particular model,people often fail to take the size of the sample into account:after all,a small sample can be just as representative as a large one.Six tosses of a coin resulting in three heads and three tails are as representative of a fair coin as 500 heads and 500 tails are in a total of 1000 tosses.Representativeness implies that people will find the two sets of tosses equally informative about the fairness of the coin,even though the second set is much more so. Sample size neglect means that in cases where people do not initially know the data-generating process,they will tend to infer it too quickly on the basis of too few data points.For instance,they will come to believe that a financial analyst with four good stock picks is talented because four successes are not representative of a bad or mediocre analyst.It also generates a"hot hand"phenomenon,whereby sports fans become convinced that a basketball player who has made three shots in a row is on a hot streak and will score again,even though there is no evidence of a hot hand in the data [Gilovich,Vallone and Tversky (1985)].This belief that even small samples will reflect the properties of the parent population is sometimes known as the"law of small numbers"[Rabin (2002)]. In situations where people do know the data-generating process in advance,the law of small numbers leads to a gambler's fallacy effect.If a fair coin generates five heads in a row,people will say that "tails are due".Since they believe that even a short sample should be representative of the fair coin,there have to be more tails to balance out the large number of heads. Conservatism.While representativeness leads to an underweighting of base rates, there are situations where base rates are over-emphasized relative to sample evidence. In an experiment run by Edwards(1968),there are two urns,one containing 3 blue balls and 7 red ones,and the other containing 7 blue balls and 3 red ones.A random draw of 12 balls,with replacement,from one of the urns yields 8 reds and 4 blues. What is the probability the draw was made from the first urn?While the correct answer is 0.97,most people estimate a number around 0.7,apparently overweighting the base rate of 0.5. At first sight,the evidence of conservatism appears at odds with representativeness. However,there may be a natural way in which they fit together.It appears that if a data sample is representative of an underlying model,then people overweight the data. However,if the data is not representative of any salient model,people react too little to the data and rely too much on their priors.In Edwards'experiment,the draw of 8 red and 4 blue balls is not particularly representative of either urn,possibly leading to an overreliance on prior information. 11 Mullainathan (2001)presents a formal model that neatly reconciles the evidence on underweighting sample information with the evidence on overweighting sample information
Ch. 18: A Survey of Behavioral Finance 1067 Representativeness also leads to another bias, sample size neglect. When judging the likelihood that a data set was generated by a particular model, people often fail to take the size of the sample into account: after all, a small sample can be just as representative as a large one. Six tosses of a coin resulting in three heads and three tails are as representative of a fair coin as 500 heads and 500 tails are in a total of 1000 tosses. Representativeness implies that people will find the two sets of tosses equally informative about the fairness of the coin, even though the second set is much more so. Sample size neglect means that in cases where people do not initially know the data-generating process, they will tend to infer it too quickly on the basis of too few data points. For instance, they will come to believe that a financial analyst with four good stock picks is talented because four successes are not representative of a bad or mediocre analyst. It also generates a “hot hand” phenomenon, whereby sports fans become convinced that a basketball player who has made three shots in a row is on a hot streak and will score again, even though there is no evidence of a hot hand in the data [Gilovich, Vallone and Tversky (1985)]. This belief that even small samples will reflect the properties of the parent population is sometimes known as the “law of small numbers” [Rabin (2002)]. In situations where people do know the data-generating process in advance, the law of small numbers leads to a gambler’s fallacy effect. If a fair coin generates five heads in a row, people will say that “tails are due”. Since they believe that even a short sample should be representative of the fair coin, there have to be more tails to balance out the large number of heads. Conservatism. While representativeness leads to an underweighting of base rates, there are situations where base rates are over-emphasized relative to sample evidence. In an experiment run by Edwards (1968), there are two urns, one containing 3 blue balls and 7 red ones, and the other containing 7 blue balls and 3 red ones. A random draw of 12 balls, with replacement, from one of the urns yields 8 reds and 4 blues. What is the probability the draw was made from the first urn? While the correct answer is 0.97, most people estimate a number around 0.7, apparently overweighting the base rate of 0.5. At first sight, the evidence of conservatism appears at odds with representativeness. However, there may be a natural way in which they fit together. It appears that if a data sample is representative of an underlying model, then people overweight the data. However, if the data is not representative of any salient model, people react too little to the data and rely too much on their priors. In Edwards’ experiment, the draw of 8 red and 4 blue balls is not particularly representative of either urn, possibly leading to an overreliance on prior information 11. 11 Mullainathan (2001) presents a formal model that neatly reconciles the evidence on underweighting sample information with the evidence on overweighting sample information