Chap.1 Introduction 女 devoted to theoretical and practical issues in exploratory data analysis itself.We have tried to provide an understandable but complete exposition of cluster analysis that uses only enough mathematical detail to make the material precise.The space limitation makes it difficult for us to cover every aspect of cluster analysis in great detail.We emphasize informal algorithms for clustering methods,and analysis of results.However,a reader may have difficulty in implementing the algorithms from the description given in Chapter 3.Most of the well-known clustering algo- rithms have been implemented and are available as part of clustering and statistical software packages (see Section 3.4).We see cluster analysis as a tool to be used, not as a theory to be developed. In Chapter 2 we present our idea of data with emphasis on ways of viewing data,such as projections based on eigenvectors and multidimensional scaling. Four ways in which data are analyzed that are related to cluster analysis are reviewed so as to clarify the role of cluster analysis.Clustering methods and algorithms themselves are described in Chapter 3.The primary division among clustering methods is between hierarchical and partitional methods.Both approaches are carefully developed and several examples are provided.The availability of clustering software,methodology by which cluster analysis can be applied,and comparative studies of various clustering techniques are also summarized in Chapter 3.A comparative analysis of clustering methods is useful since empirical evidence seems to be the only practical guide to the selection of clustering methods. The crucial step in applications of cluster analysis is the interpretation of the results.In Chapter 4 we present a comprehensive summary of procedures for quantitatively verifying the results of cluster analysis.Monte Carlo techniques along with the method of bootstrapping are also introduced in Chapter 4,because they are useful for estimating the distributions of various cluster statistics.Applica- tions of clustering to an engineering domain (image processing and computer vision)are discussed in Chapter 5.The book also contains eight appendices to review briefly related topics of pattern recognition,commonly used Gaussian and hypergeometric distributions,linear algebra,scatter matrices,factor analysis,multi- variate analysis of variance,and graph theory.An algorithm to generate clustered data is also given in one of the appendices.We hasten to add that these appendices contain only elementary material provided for the convenience of the reader.The reader should consult standard textbooks for detailed coverage of these topics. This is not the first book on cluster analysis.Anderberg (1973)has written the most comprehensive book for those who want to use cluster analysis.We refer frequently to Anderberg's excellent exposition.Everitt (1974)explains cluster analysis in a very readable way but contains fewer details than we feel are necessary. Tryon and Bailey (1970)wrote one of the first books on cluster analysis,but it is restricted to a single approach.Jardine and Sibson(1971)concentrate on mathe- matical foundations.Other early books are those of Duran and Odell (1974)and Clifford and Stephenson (1975).Sneath and Sokal (1973)include an excellent chapter on hierarchical clustering.Hartigan(1975)provides a number of interesting projects,and Lorr(1983)presents cluster analysis especially for social scientists
6 Introduction Chap.1 Van Ryzin (1977)provides a good collection of interesting papers.The book by Gordon (1981)is another excellent reference.As cluster analysis has become an accepted methodology,chapters in books and long summary papers have appeared. Enslein et al.(1977)emphasize computational matters in their chapter on clustering. Cormack (1971)wrote one of the first summaries of cluster analysis.Three papers appear in Volume 2 of Handbook of Statistics (Krishnaiah and Kanal,1982). Lee (1981)provides a long chapter in Volume 8 of Advances in Information System Science,and Dubes and Jain (1980)contributed a chapter to Volume 19 of Advances in Computers.The chapter by Hawkins et al.(1982)in Topics in Applied Multivariate Analysis emphasizes model fitting and tests for number of clusters.Diday and Simon (1976)and Jain (1986)cover clustering algorithms in the context of pattern recognition and image processing.We owe an intellectual debt to all of the precursors of this book. The treatment in this book is not mathematical but uses mathematical notation and concepts.Chapter 4 requires more mathematical sophistication than do the other chapters.For the clearest understanding of the material,it is best to read the book in the order presented.However,each chapter contains many details that can be omitted on first reading.We have tried to list all applicable current literature and apologize for inadvertently omitting any important papers.We hope that some parts of this book will appeal to all who use cluster analysis and that the book will help those first encountering cluster analysis to get to the important issues in a timely manner
二2 Data Representation The first prerequisite for a rational application of cluster analysis is an appreciation for the basic factors required to represent the data.Clustering algorithms are matched to data type,and unless factors such as scale,normalization,and types of proximity measures are understood,one can be misled when interpreting the results of a clustering algorithm.The first three sections discuss these issues and define many of the terms used throughout the book. Cluster analysis is a tool for exploring data and must be supplemented by techniques for visualizing data.The most direct visualization is a two-dimensional plot showing the objects to be clustered as points.Multivariate data cannot always be faithfully reproduced in two dimensions but when valid,such a representation is helpful in verifying the results of a clustering algorithm.Sections 2.4 and 2.5 cover some common linear and nonlinear techniques for projecting and representing multivariate data.Some mathematical and statistical concepts needed to understand linear projections are summarized in Appendices B,C,and D.The equations derived to explain linear projections in Section 2.4 bear some resemblance to equations from multivariate statistics.Thus Appendices E and F review two related topics from statistical data analysis:factor analysis,and multivariate analysis of variance. The intrinsic,or topological,dimensionality of a data set dictates the smallest number of factors needed to represent the data.Ways of estimating intrinsic dimen- sionality are reviewed in Section 2.6.Multidimensional scaling,the topic of Section 2.7.is a procedure for representing qualitative data in a space of few dimensions and supplements cluster analysis. 7
Data Representation Chap.2 2.1 DATA TYPES AND DATA SCALES Clustering algorithms group objects,or data items,based on indices of proximity between pairs of objects.The objects themselves have been called individuals, cases,subjects,and OTUs (operational taxonomic units)in various applications. This book uses pattern recognition terminology(Appendix A).A set of objects comprises the raw data for a cluster analysis and can be described by two standard formats:a pattern matrix and a proximity matrix. 2.1.1 Pattern Matrix If each object in a set of n objects is represented by a set of d measurements (or attributes or scores),each object is represented by a pattern,or d-place vector. The set itself is viewed as a n x d pattern matrix.Each row of this matrix defines a pattern and each column denotes a feature,or measurement.For example, when clustering time functions such as biological signals or radar echoes,a feature could be a sample value taken at a particular time;the average value of the signal could also be a feature.The set of feature values for a signal is a pattern.We require that the same features be measured for all patterns.If patients in a hospital are to be clustered,each row in the pattern matrix would represent one individual. The features,or columns in the pattern matrix,could represent responses to questions on an admission form or the results of diagnostic tests.The same questions must be asked of every patient and the same diagnostic tests must be performed on all patients in a particular experiment.Categorical,or extrinsic,information,such as age,sex,religion,or hair color,is normally used to interpret the results of a cluster analysis but is not part of the pattern matrix. The d features are usually pictured as a set of orthogonal axes.The n patterns are then points embedded in a d-dimensional space called a pattern space.We use the word "pattern''in the technical sense as a point in a pattern space,not to describe the topological arrangement of objects.A cluster can be visualized as a collection of patterns which are close to one another or which satisfy some spatial relationships.The task of a clustering algorithm is to identify such natural groupings in spaces of many dimensions.Although visual perception is limited to three dimensions,one must be careful not to think automatically of clustering problems as two-or three-dimensional.The real benefit of cluster analysis is to organize multidimensional data where visual perception fails. Example 2.1 This example shows the pattern matrix representation of a data set,called the 80X data, that will be used to demonstrate several projection and clustering methods.This data set was derived from the Munson handprinted FORTRAN character set,which has been used extensively in pattern recognition studies and consists of handwritten characters from several authors,each of whom wrote three alphabets of 46 characters.The handwritten characters
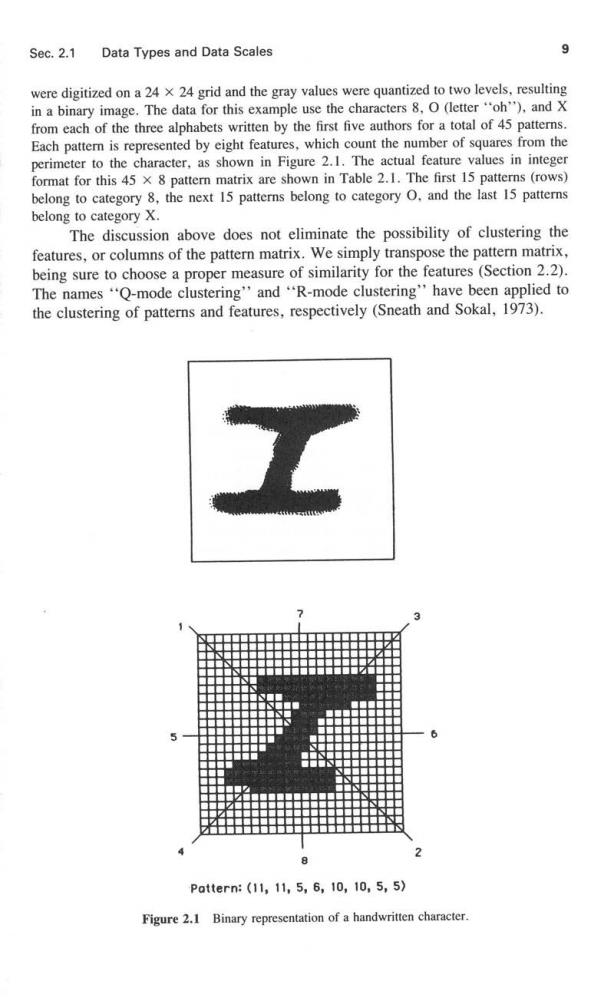
Sec.2.1 Data Types and Data Scales 9 were digitized on a 24 x 24 grid and the gray values were quantized to two levels,resulting in a binary image.The data for this example use the characters 8,O (letter"'oh'').and X from each of the three alphabets written by the first five authors for a total of 45 patterns. Each pattern is represented by eight features,which count the number of squares from the perimeter to the character,as shown in Figure 2.1.The actual feature values in integer format for this 45 x 8 pattern matrix are shown in Table 2.1.The first 15 patterns (rows) belong to category 8,the next 15 patterns belong to category O.and the last 15 patterns belong to category X. The discussion above does not eliminate the possibility of clustering the features,or columns of the pattern matrix.We simply transpose the pattern matrix, being sure to choose a proper measure of similarity for the features (Section 2.2). The names"Q-mode clustering'and"R-mode clustering"have been applied to the clustering of patterns and features,respectively (Sneath and Sokal,1973). 工 2 Pattern:(1l,11,5,6,10,10,5,5) Figure 2.1 Binary representation of a handwritten character