Momentum Strategies 1685 it as our model of expected earnings.The SUE for stock i in month t is thus defined as SUEn=eiae- (1) Gi where eig is quarterly earnings per share most recently announced as of month t for stock i,ei-4 is earnings per share four quarters ago,and oit is the standard deviation of unexpected earnings,eig-eig-4,over the preceding eight quarters. Another measure of earnings surprise is the cumulative abnormal stock return around the most recent announcement date of earnings up to month t, ABR,defined as +1 ABRa=∑(ri-rm) (2) j=-2 where ri;is stock i's return on day j(with the earnings being announced on day 0)and rmj is the return on the equally-weighted market index.We cumulate returns until one day after the announcement date to account for the possi- bility of delayed stock price reaction to earnings news,particularly since our sample includes Nasdaq issues that may be less frequently traded.This return-based measure is a fairly clean measure of earnings surprise,since it does not require an explicit model for earnings expectations.However,the abnormal return around the announcement captures the change over a win- dow of only a few days in the market's views about earnings.The SUE measure incorporates the information up to the last quarter's earnings and hence in principle measures earnings surprise over a longer period. Our final measure of earnings news is given by changes in analysts'forecasts of earnings.Since analyst estimates are not necessarily revised every month, many of the monthly revisions take the value of zero.To get around this,we define REV6,a six-month moving average of past changes in earnings fore- casts by analysts: REv6u=∑f-f 6 (3) j=0P-j-1 where fit is the consensus (mean)I/B/E/S estimate in month t of firm i's earnings for the current fiscal year(FY1).The monthly revisions in estimates are scaled by the prior month's stock price.1 Analyst estimates are available on 1 Scaling the revisions by the stock price penalizes stocks with high price-earnings ratios.To circumvent this possibility,we also scaled revisions by the book value per share.We also exper- imented with the percent change in the median I/B/E/S estimate,as well as the difference between
1686 The Journal of Finance a monthly basis2 and dispense with the need for a model of expected earnings. However,the estimates issued by analysts may be colored by other incentives such as the desire to encourage investors to trade and hence generate broker- age commissions.3 As a result,analyst forecasts may not be a clean measure of expected earnings. For each of our momentum strategies,we report buy-and-hold returns in the periods subsequent to portfolio formation.Returns measured over contiguous intervals may be spuriously related due to bid-ask bounce,thereby attenuating the performance of the price momentum strategy.To control for this effect,we skip the first five days after portfolio formation before we begin to measure returns under the price momentum strategy and,for the sake of comparability, under the earnings momentum strategy as well.If a stock is delisted after it is included in a portfolio but before the end of the holding period over which returns are calculated,we replace its return until the end of the period with the return on a value-weighted market index.At the end of the period we rebalance all the remaining stocks in the original portfolio to equal weights in order to calculate returns in subsequent periods.In addition to returns on the portfolios,we also report two attributes of our portfolios-the book-to-market value of equity and the ratio of cash flow (earnings plus depreciation)to price-at the time of portfolio formation.Finally,we also track our three measures of earnings surprise(SUE,ABR,and REV6)at the time of portfolio formation and thereafter. II.Price and Earnings Momentum:Univariate Analysis A.Price Momentum We first examine the ability of each of the momentum strategies to predict future returns,and the characteristics of the momentum portfolios.To lay the groundwork,Table I reports correlations between the various measures we use to group stocks into portfolios.The correlations are based on monthly obser- vations pooled across all stocks.Although the variables are positively corre- lated with one another,the coefficients are not large.In particular,the differ- the number of upward and downward revisions as a proportion of the number of estimates.Our results are robust to these alternative measures of analyst revisions. 2 In the context of an implementable investment strategy,all stocks are candidates for inclusion in our price momentum or earnings momentum portfolios in a given month.The strategy based on analyst revisions automatically fulfills this requirement,since consensus estimates are available at a monthly frequency.The portfolios based on standardized unexpected earnings and abnormal announcement returns will pick up an earnings variable that may be somewhat out-of-date for those firms not announcing earnings in the month of portfolio formation.This may lead to an understatement of the returns to these two earnings momentum strategies,but in any event we are able to compare directly the results from the price momentum and from the earnings momen- tum strategies. 3 Several recent examples of these kinds of pressures on analysts are described by Michael Siconolfi in "A rare glimpse at how Wall Street covers clients,"Wall Street Journal,July 14,1995, and "Incredible buys:Many companies press analysts to steer clear of negative ratings,"Wall Street Journal,July 19,1995
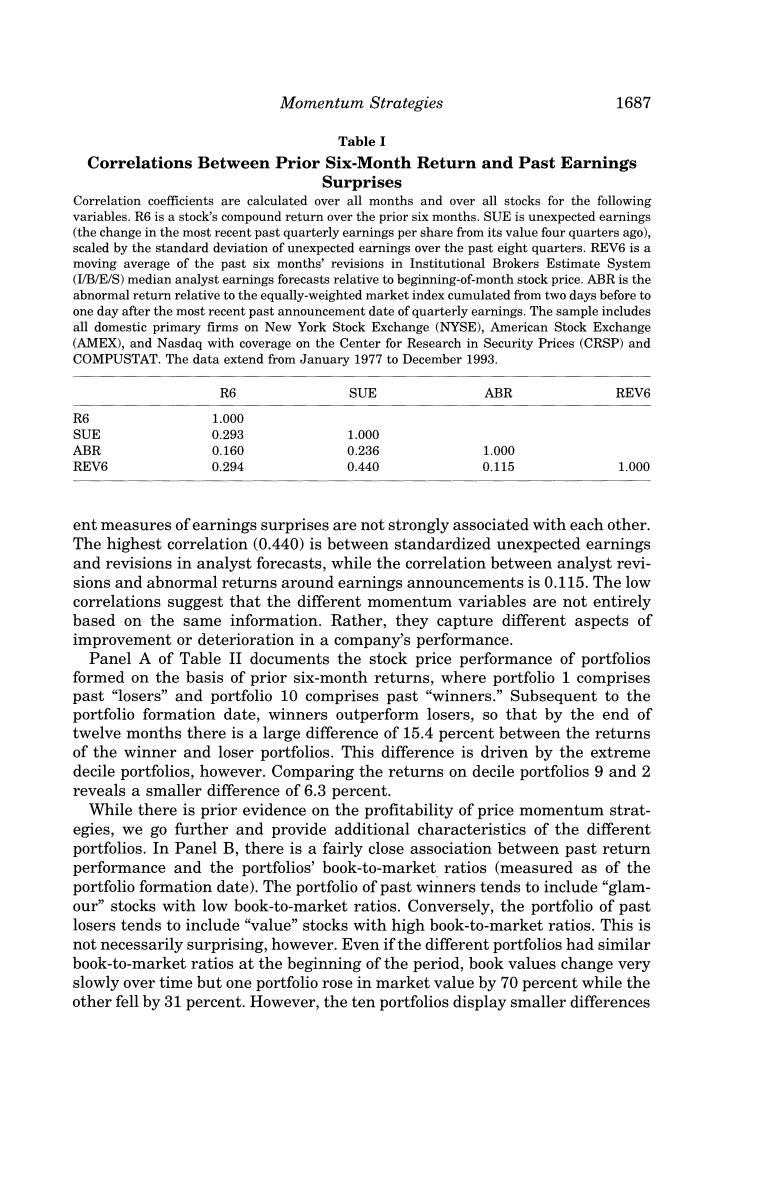
Momentum strategies 1687 Table I Correlations Between Prior Six-Month Return and Past Earnings Surprises Correlation coefficients are calculated over all months and over all stocks for the following variables.R6 is a stock's compound return over the prior six months.SUE is unexpected earnings (the change in the most recent past quarterly earnings per share from its value four quarters ago), scaled by the standard deviation of unexpected earnings over the past eight quarters.REV6 is a moving average of the past six months'revisions in Institutional Brokers Estimate System (I/B/E/S)median analyst earnings forecasts relative to beginning-of-month stock price.ABR is the abnormal return relative to the equally-weighted market index cumulated from two days before to one day after the most recent past announcement date of quarterly earnings.The sample includes all domestic primary firms on New York Stock Exchange (NYSE),American Stock Exchange (AMEX),and Nasdaq with coverage on the Center for Research in Security Prices (CRSP)and COMPUSTAT.The data extend from January 1977 to December 1993. R6 SUE ABR REV6 R6 1.000 SUE 0.293 1.000 ABR 0.160 0.236 1.000 REV6 0.294 0.440 0.115 1.000 ent measures of earnings surprises are not strongly associated with each other. The highest correlation(0.440)is between standardized unexpected earnings and revisions in analyst forecasts,while the correlation between analyst revi- sions and abnormal returns around earnings announcements is 0.115.The low correlations suggest that the different momentum variables are not entirely based on the same information.Rather,they capture different aspects of improvement or deterioration in a company's performance. Panel A of Table II documents the stock price performance of portfolios formed on the basis of prior six-month returns,where portfolio 1 comprises past "losers"and portfolio 10 comprises past "winners."Subsequent to the portfolio formation date,winners outperform losers,so that by the end of twelve months there is a large difference of 15.4 percent between the returns of the winner and loser portfolios.This difference is driven by the extreme decile portfolios,however.Comparing the returns on decile portfolios 9 and 2 reveals a smaller difference of 6.3 percent. While there is prior evidence on the profitability of price momentum strat- egies,we go further and provide additional characteristics of the different portfolios.In Panel B,there is a fairly close association between past return performance and the portfolios'book-to-market ratios (measured as of the portfolio formation date).The portfolio of past winners tends to include"glam- our"stocks with low book-to-market ratios.Conversely,the portfolio of past losers tends to include "value"stocks with high book-to-market ratios.This is not necessarily surprising,however.Even if the different portfolios had similar book-to-market ratios at the beginning of the period,book values change very slowly over time but one portfolio rose in market value by 70 percent while the other fell by 31 percent.However,the ten portfolios display smaller differences
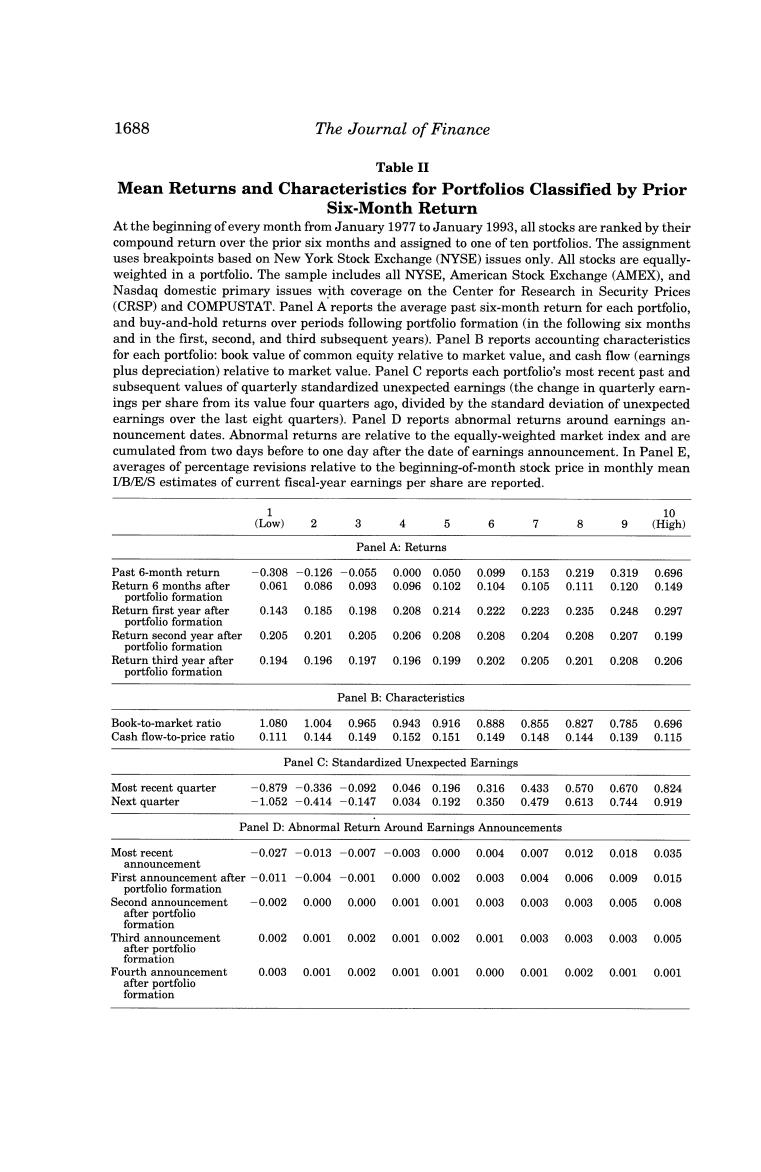
1688 The Journal of Finance Table II Mean Returns and Characteristics for Portfolios Classified by Prior Six-Month Return At the beginning of every month from January 1977 to January 1993,all stocks are ranked by their compound return over the prior six months and assigned to one of ten portfolios.The assignment uses breakpoints based on New York Stock Exchange (NYSE)issues only.All stocks are equally- weighted in a portfolio.The sample includes all NYSE,American Stock Exchange (AMEX),and Nasdaq domestic primary issues with coverage on the Center for Research in Security Prices (CRSP)and COMPUSTAT.Panel A reports the average past six-month return for each portfolio, and buy-and-hold returns over periods following portfolio formation(in the following six months and in the first,second,and third subsequent years).Panel B reports accounting characteristics for each portfolio:book value of common equity relative to market value,and cash flow (earnings plus depreciation)relative to market value.Panel C reports each portfolio's most recent past and subsequent values of quarterly standardized unexpected earnings(the change in quarterly earn- ings per share from its value four quarters ago,divided by the standard deviation of unexpected earnings over the last eight quarters).Panel D reports abnormal returns around earnings an- nouncement dates.Abnormal returns are relative to the equally-weighted market index and are cumulated from two days before to one day after the date of earnings announcement.In Panel E, averages of percentage revisions relative to the beginning-of-month stock price in monthly mean I/B/E/S estimates of current fiscal-year earnings per share are reported. 1 10 (L0w) 3 6 7 9 (High) Panel A:Returns Past 6-month return -0.308-0.126-0.0550.0000.0500.0990.153 0.2190.319 0.696 Return 6 months after 0.061 0.0860.093 0.0960.1020.1040.105 0.1110.120 0.149 portfolio formation Return first year after 0.143 0.1850.198 0.2080.2140.2220.223 0.2350.248 0.297 portfolio formation Return second year after 0.205 0.2010.2050.2060.2080.2080.204 0.2080.207 0.199 portfolio formation Return third year after 0.194 0.1960.197 0.1960.1990.2020.205 0.2010.208 0.206 portfolio formation Panel B:Characteristics Book-to-market ratio 1.080 1.004 0.9650.9430.9160.888 0.8550.8270.785 0.696 Cash flow-to-price ratio 0.111 0.144 0.149 0.1520.1510.149 0.1480.1440.139 0.115 Panel C:Standardized Unexpected Earnings Most recent quarter -0.879-0.336-0.092 0.0460.1960.3160.433 0.5700.670 0.824 Next quarter -1.052-0.414-0.147 0.0340.1920.3500.479 0.6130.744 0.919 Panel D:Abnormal Return Around Earnings Announcements Most recent -0.027-0.013 -0.007 -0.0030.000 0.004 0.007 0.012 0.018 0.035 announcement First announcement after-0.011 -0.004-0.001 0.0000.002 0.003 0.004 0.006 0.009 0.015 portfolio formation Second announcement -0.002 0.000 0.000 0.0010.001 0.0030.003 0.003 0.005 0.008 after portfolio formation Third announcement 0.002 0.001 0.002 0.0010.0020.0010.003 0.003 0.003 0.005 atter porttolio formation Fourth announcement 0.0030.0010.0020.0010.0010.0000.0010.0020.001 0.001 after portfolio formation
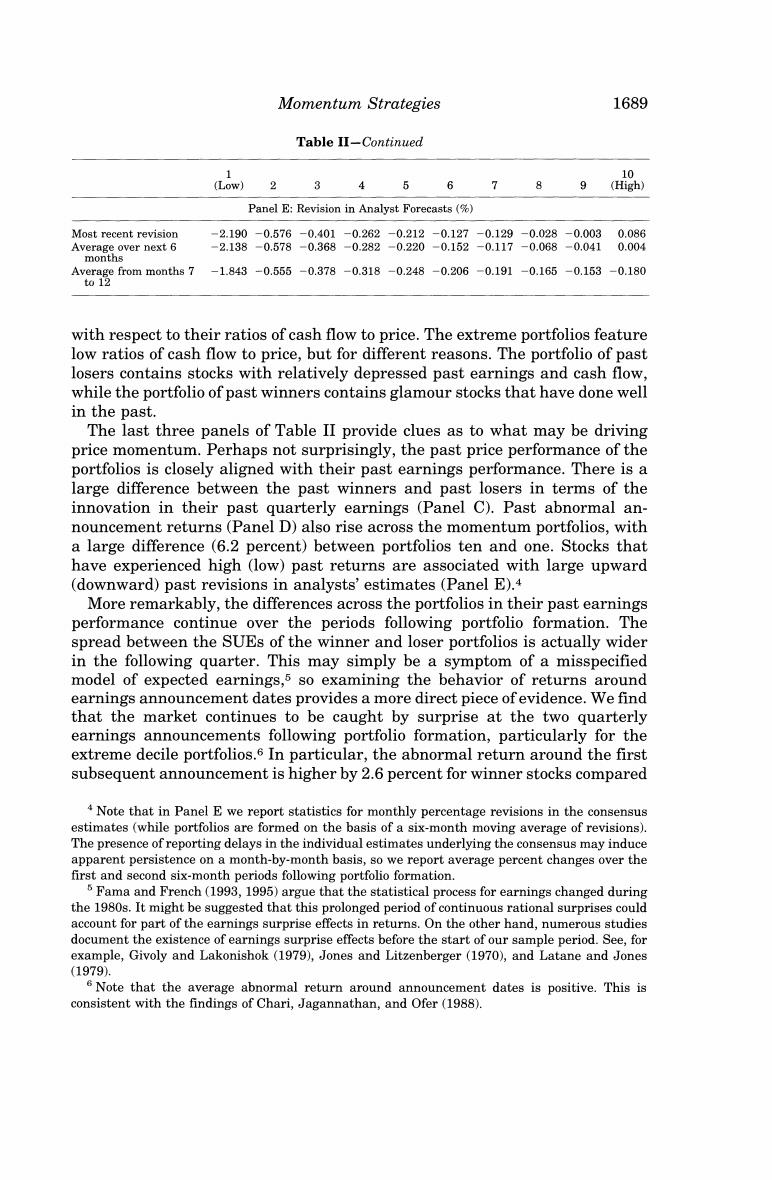
Momentum Strategies 1689 Table II-Continued 10 (Low) 2 3 4 5 6 7 8 9 (High) Panel E:Revision in Analyst Forecasts(%) Most recent revision -2.190-0.576-0.401 -0.262-0.212-0.127-0.129-0.028-0.003 0.086 Average over next 6 -2.138-0.578-0.368-0.282-0.220-0.152-0.117-0.068-0.041 0.004 months Average from months 7 -1.843-0.555-0.378-0.318-0.248-0.206-0.191-0.165-0.153-0.180 t012 with respect to their ratios of cash flow to price.The extreme portfolios feature low ratios of cash flow to price,but for different reasons.The portfolio of past losers contains stocks with relatively depressed past earnings and cash flow, while the portfolio of past winners contains glamour stocks that have done well in the past. The last three panels of Table II provide clues as to what may be driving price momentum.Perhaps not surprisingly,the past price performance of the portfolios is closely aligned with their past earnings performance.There is a large difference between the past winners and past losers in terms of the innovation in their past quarterly earnings (Panel C).Past abnormal an- nouncement returns (Panel D)also rise across the momentum portfolios,with a large difference (6.2 percent)between portfolios ten and one.Stocks that have experienced high (low)past returns are associated with large upward (downward)past revisions in analysts'estimates (Panel E).4 More remarkably,the differences across the portfolios in their past earnings performance continue over the periods following portfolio formation.The spread between the SUEs of the winner and loser portfolios is actually wider in the following quarter.This may simply be a symptom of a misspecified model of expected earnings,5 so examining the behavior of returns around earnings announcement dates provides a more direct piece of evidence.We find that the market continues to be caught by surprise at the two quarterly earnings announcements following portfolio formation,particularly for the extreme decile portfolios.6 In particular,the abnormal return around the first subsequent announcement is higher by 2.6 percent for winner stocks compared 4 Note that in Panel E we report statistics for monthly percentage revisions in the consensus estimates (while portfolios are formed on the basis of a six-month moving average of revisions) The presence of reporting delays in the individual estimates underlying the consensus may induce apparent persistence on a month-by-month basis,so we report average percent changes over the first and second six-month periods following portfolio formation. 5 Fama and French(1993,1995)argue that the statistical process for earnings changed during the 1980s.It might be suggested that this prolonged period of continuous rational surprises could account for part of the earnings surprise effects in returns.On the other hand,numerous studies document the existence of earnings surprise effects before the start of our sample period.See,for example,Givoly and Lakonishok (1979),Jones and Litzenberger (1970),and Latane and Jones (1979). s Note that the average abnormal return around announcement dates is positive.This is consistent with the findings of Chari,Jagannathan,and Ofer(1988)