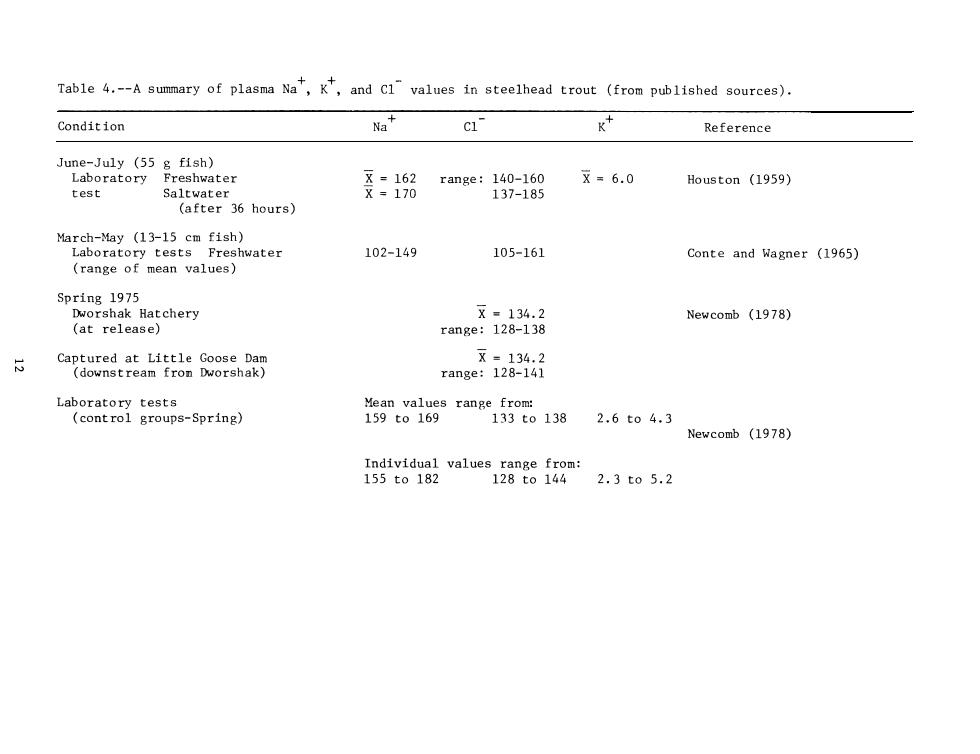
Table 4.--A summary of plasma Na,K,and C1"values in steelhead trout (from published sources). Condition Na C1 K+ Reference June-July (55 g fish) Laboratory Freshwater test 是:18 range:.9=69 x=6.0 Houston(1959)) 137-185 March-May (13-15 cm fish) Laboratory tests Freshwater 102-149 105-161 Conte and Wagner (1965) (range of mean values) Spring 1975 hery rane Newcomb(1978) Laboratory tests Mean values range from: (control groups-Spring) 159t0169 133t01382.6t04.3 Newcomb (1978) Individual values range from: 155to182 128to1442.3t05.2

(Newcomb 1978).Newcomb's data are extensive,represent reasonably large sample sizes (15 to 25),and are probably good approximations of Columbia River steelhead. The mean plasma Na+and K+values of the chelan Hatchery steelhead were within normal limits (Table 3,Figure 2)at the time of release.The Na+levels increased in seawater,but returned to normal (in the survivors)after 1 week. Hematology There is considerable hematological data in the literature for rainbow trout,less for steelhead trout.From the data summarized in Table 5,it may be possible to estimate the range of hematocrit and hemoglobin values for healthy steelhead.The lower limit of mean hematocrit should not fall below 30X,and mean hemoglobin values below 6 would certainly be suspect. Upper levels are more difficult to define.Snieszko (1960)reports mean hematocrits of 538 and mean hemoglobin levels of 8.7 g/100 ml of blood in rainbow trout of a size comparable to large steelhead smolts.Although our values on steelhead trout (Table 3)were much closer to Snieszko's,Newcomb (1978)reported mean hematocrit levels in steelhead similar to that found by other researchers working on rainbow trout (Table 5).A number of authors (McCarthy et al.1973;Wedemeyer and Nelson 1975;Wedemeyer and Yasutake 1977)repeatedly suggest that the hematocrit levels of clinically healthy rainbow trout should be between 24 and 438,with hemoglobins ranging from 5.4 to 9.3 g/100 ml blood,and these values will be used as the expected range for individual fish for the purposes of this report. The summarized data of the hematocrit and hemoglobin values for the Chelan Hatchery steelhead are presented in Figure 3.There was no difference in mean hemoglobin between 1978 and 1979 (8.9 g/100 ml)nor in 13
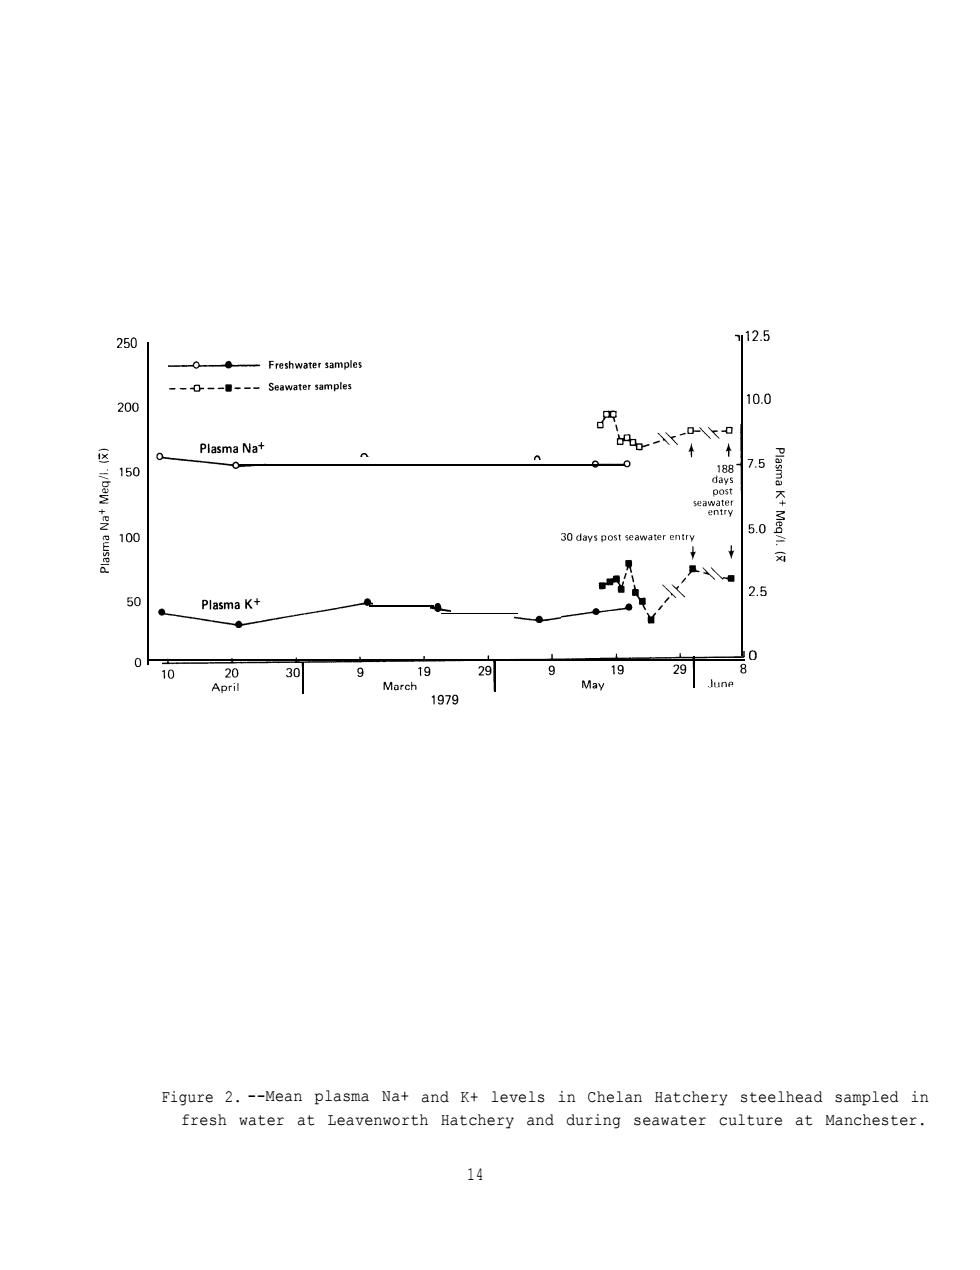
(Newcomb 1978). Newcomb's data are extensive, represent reasonably large sample sizes (15 to 25), and are probably good approximations of Columbia River steelhead. The mean plasma Na+ and K+ values of the Chelan Hatchery steelhead were within normal limits (Table 3, Figure 2) at the time of release. The Na+ levels increased in seawater, but returned to normal (in the survivors) after 1 week. Hematology There is considerable hematological data in the literature for rainbow trout, less for steelhead trout. From the data summarized in Table 5, it may be possible to estimate the range of hematocrit and hemoglobin values for healthy steelhead. The lower limit of mean hematocrit should not fall below 30X, and mean hemoglobin values below 6 would certainly be suspect. Upper levels are more difficult to define. Snieszko (1960) reports mean hematocrits of 53% and mean hemoglobin levels of 8.7 g/100 ml of blood in rainbow trout of a size comparable to large steelhead smolts. Although our values on steelhead trout (Table 3) were much closer to Snieszko's, Newcomb (1978) reported mean hematocrit levels in steelhead similar to that found by other researchers working on rainbow trout (Table 5). A number of authors (McCarthy et al. 1973; Wedemeyer and Nelson 1975; Wedemeyer and Yasutake 1977) repeatedly suggest that the hematocrit levels of clinically healthy rainbow trout should be between 24 and 43%, with hemoglobins ranging from 5.4 to 9.3 g/100 ml blood, and these values will be used as the expected range for individual fish for the purposes of this report. The summarized data of the hematocrit and hemoglobin values for the Chelan Hatchery steelhead are presented in Figure 3. There was no difference in mean hemoglobin between 1978 and 1979 (8.9 g/100 ml) nor in 13
250 12.5 -------Seawater samples 200 10.0 Plasma Nat 150 75 100 30 days 2.5 Plasma K+ 10 30■ 29 1979 Figure 2.--Mean plasma Na+and K+levels in Chelan Hatchery steelhead sampled in fresh water at Leavenworth Hatchery and during seawater culture at Manchester. 14
Figure 2. --Mean plasma Na+ and K+ levels in Chelan Hatchery steelhead sampled in fresh water at Leavenworth Hatchery and during seawater culture at Manchester. 14
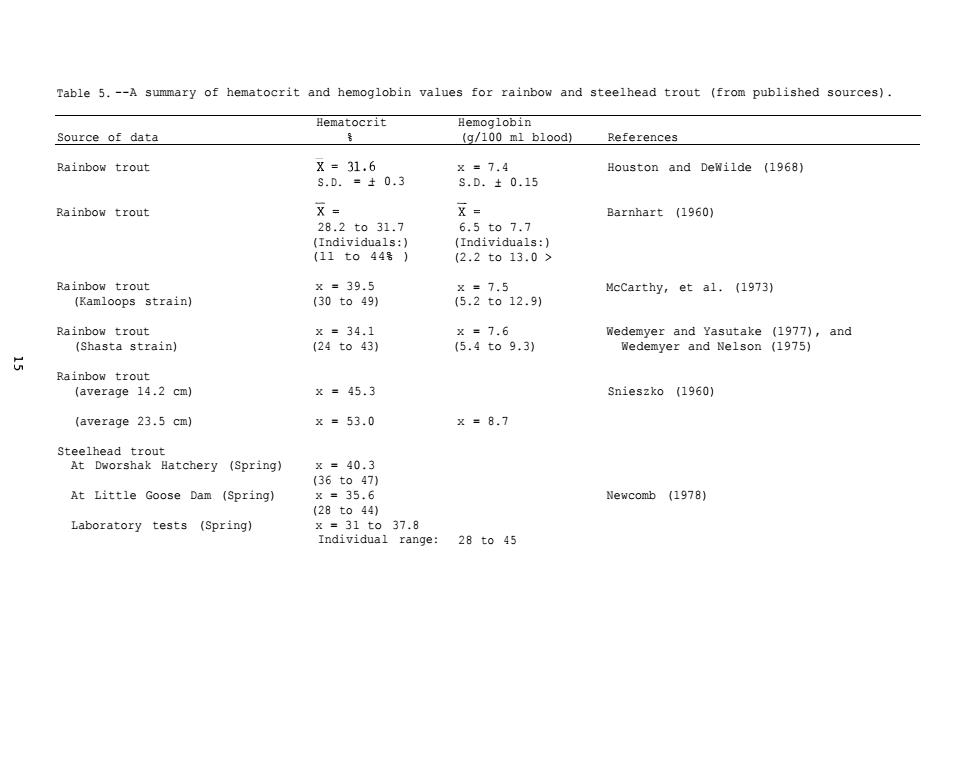
Table 5.--A summary of hematocrit and hemoglobin values for rainbow and steelhead trout (from published sources) Hematocrit Hemoglobin Source of data (g/100 ml blood) References Rainbow trout X=31.6 5.D.=±0.3 0a5 Houston and Dewilde (1968) Rainbow trout X= X= Barnhart (1960) 28.2t031.7 6.5t07.7 (Individuals:】 (2.2to13.0> Rainbow trout 0098 8262.1 McCarthy,et al.(1973) (Kamloops strain) Rainbow trout (Shasta strain) 。 876, Rainb ×=45.3 Snieszko (1960) (average 23.5 cm) x=53.0 x=8.7 Steelhead trout At Dworshak Hatchery (Spring) At Little Goose Dam (Spring) Newcomb (1978) (28to44) Laboratory tests (Spring) ndat837 range: 28t045
Table 5. --A summary of hematocrit and hemoglobin values for rainbow and steelhead trout (from published sources). Source of data Hematocrit Hemoglobin % (g/100 ml blood) References Rainbow trout Rainbow trout Rainbow trout (Kamloops strain) Rainbow trout (Shasta strain) Rainbow trout (average 14.2 cm) (average 23.5 cm) Steelhead trout At Dworshak Hatchery (Spring) At Little Goose Dam (Spring) Laboratory tests (Spring) S.D. = + 0.3 - x = 7.4 S.D. + 0.15 - Houston and DeWilde (1968) 28.2 to 31.7 (Individuals:) (11 to 44% ) x = 39.5 (30 to 49) x = 34.1 (24 to 43) x = 45.3 x = 53.0 6.5 to 7.7 (Individuals:) (2.2 to 13.0 > Barnhart (1960) x = 7.5 (5.2 to 12.9) McCarthy, et al. (1973) x = 7.6 (5.4 to 9.3) Wedemyer and Yasutake (1977), and Wedemyer and Nelson (1975) Snieszko (1960) x = 8.7 x = 40.3 (36 to 47) x = 35.6 (28 to 44) x = 31 to 37.8 Individual range: 28 to 45 Newcomb (1978)

6101-6160 Apri126,1979 steelhead Chelan 40 n=60 35 x=49.8 5=7.7 30 25 0 10 405060708090100 Percent(%)Hematocrit 40 36 8.86 5= 1.58 30 20 o 5 0 2 6 8101214161820 Hemoglobin-g/dcl blood Figure 3.--Frequency histogram for hematocrit and hemoglobin values for the 8e1en6cteva8ge,n273anaaa86v5ti6后8ag'g8.heaog1obin 16
6101 - 6160 April 26, 1979 Steelhead Chelan Figure 3.--Frequency histogram for hematocrit and hemoglobin values for the Chelan Hatchery steelhead in 1979. and hematocrit values (x), Number of fish sampled (n), mean hemoglobin and standard deviation (s) are also given. 16