
Big data popularity on the web big data data mining machine learning 搜索字词 搜索字词 搜索字词 +添加字词 热度随时间变化的趋势? ☑新闻头条☑预测⑦ M 平均值 2005 2007 2009 2011 2013 2015 15
Big data popularity on the web 15

硼 “Era of Big Data”-WHY? 16
“Era of Big Data” – WHY? 16
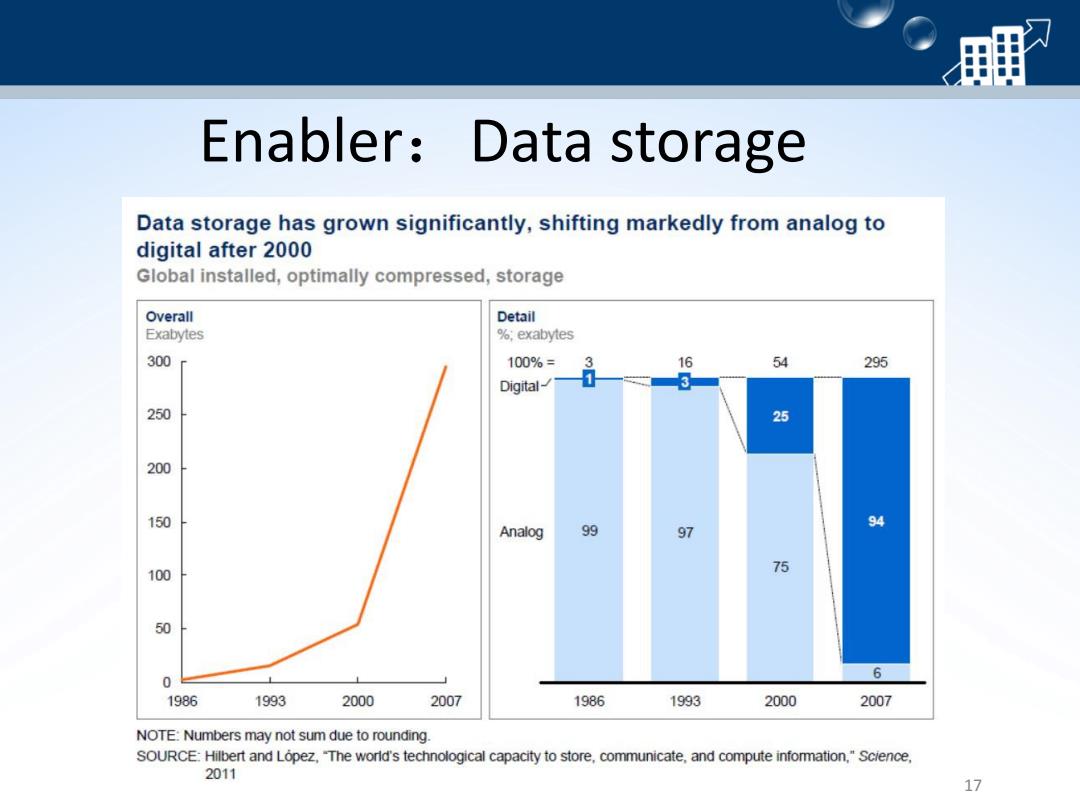
Enabler:Data storage Data storage has grown significantly,shifting markedly from analog to digital after 2000 Global installed,optimally compressed,storage Overall Detail Exabytes %exabytes 300 100%= 3 16 54 295 Digital- 250 25 200 150 94 Analog 99 97 100 75 50 6 1986 1993 2000 2007 1986 1993 2000 2007 NOTE:Numbers may not sum due to rounding. SOURCE:Hilbert and Lopez,"The world's technological capacity to store,communicate,and compute infommation,"Science, 2011 17
Enabler:Data storage 17

Enabler:Computation Power Computation capacity has also risen sharply Global installed computation to handle information Overall Detail ■ Pocket calculators ■ Mobile phones/PDA 1012 million instructions per second %1012 million ■ Supercomputers Video game consoles 6.5 instructions per second Servers and ■ Personal computers 6.0 mainframes <0.001 0.004 0.289 6.379 100%+ 6 6 3 6 15510 23 25 530 6 17 2 86 9 64 66 0 33 0.5 0 1986 1993 2000 2007 1986 1993 2000 2007 NOTE:Numbers may not sum due to rounding. SOURCE:Hilbert and Lopez."The world's technological capacity to store,communicate,and compute information,"Science, 2011 18
Enabler:Computation Power 18

Enabler:Data availability Companies in all sectors have at least 100 terabytes of stored data in the United States;many have more than 1 petabyte Stored data in the Stored data per firm United States,20091 Number of firms with (>1,000 employees).2009 Petabytes >1,000 employees2 Terabytes Discrete manufacturing3 966 1.000 19672 Government 848 647 1.312 Communications and media 715 399 11.792 Process manufacturing3 694 835 8312 Banking 619 321 1.931 Health care providers3 434 1,172 370 Securities and investment services 429 111 3,866 Professional services 411 1,478 278 Retail 364 522 ■697 Education 269 843 319 Insurance 243 280 870 Transportation 227 283 801 Wholesale 202 376 536 Utilities 194 129 11.507 Resource industries 116 140 825 Consumer recreational services 106 708 150 Construction 51 222 231 1 Storage data by sector derived from IDC. 2 Firm data split into sectors,when needed,using employment 3 The particularly large number of firms in manufacturing and health care provider sectors make the available storage per company much smaller. SOURCE:IDC:US Bureau of Labor Statistics;McKinsey Global Institute analysis 19
Enabler:Data availability 19