Lesson 3 Data Commentary You may or may not need to work on Language Focus in this handout (You most probably do not need to print those pages ifyou would prefer reading the paper copy of this handout).All exercises are obligatory. Your chosen research articles from top journals in your discipline (in virtual pdf version)are supposed to be brought to the classroom and copied to corresponding folders respectively on the classroom computer in L3.You may need to read a part of your chosen journal articles in L3. Lesson 3 Reading and Writing the Results I:Data Commentary The Results section presents the outcome of the investigation.The goal in writing the section is more than to simply present the results of your investigation;it is to make them understandable for readers. Data Commentary is the indispensable unit of the Results,and of everyday delivery of ideas. If you have a great deal of data to present,do so in three stages. 1)Give a general overview in one or two sentences.For example,"The results obtained indicate that the film temperature increases as the rolling velocity or slide-roll ratio increases." 2)Present representative data,not the whole mass of data obtained.This is particularly important if an experiment or set of experiments were repeated several times. 3)If it is necessary to provide more than the representative data,do so in an Appendix, not in the text of your paper.This would also be done for interesting data observed but which otherwise did not affect the outcome of your investigation. If you have a great deal of data to present,do not hesitate to use figures and tables We use the term display/figure to include charts,diagrams,drawings,and photographs.Rely upon your text to describe your findings,pointing out the most significant and comprehensive findings presented in your displays.The human mind is capable of grasping a great deal of complex information when presented in a graphic than when presented in text."A picture is worth a thousand words."While in your text you can point out data that is displayed in a table,do not repeat the data in both places.This redundancy only adds unnecessary bulk to your paper. Findings can be described and commented upon in four different ways:statement of fact,behavior over a range,comparison and contrast,and cause and effect.The following are examples of the former two. Statement of fact: It was verified that the average error in fuel spray droplet size is less than 10%. Behavior over a range: The interface between the saturated and unsaturated regions existed,but did not continue to exist when the water content was increased.The temperature at which the maximum concentration of H-related donor occurs increases slightly with thermal neutron dose. Describe any negative results of your investigation.That is,state what you 1/12
Lesson 3 Data Commentary 1 / 12 You may or may not need to work on Language Focus in this handout (You most probably do not need to print those pages if you would prefer reading the paper copy of this handout). All exercises are obligatory. Your chosen research articles from top journals in your discipline (in virtual pdf version) are supposed to be brought to the classroom and copied to corresponding folders respectively on the classroom computer in L3. You may need to read a part of your chosen journal articles in L3. Lesson 3 Reading and Writing the Results I: Data Commentary The Results section presents the outcome of the investigation. The goal in writing the section is more than to simply present the results of your investigation; it is to make them understandable for readers. Data Commentary is the indispensable unit of the Results, and of everyday delivery of ideas. If you have a great deal of data to present, do so in three stages. 1) Give a general overview in one or two sentences. For example, “The results obtained indicate that the film temperature increases as the rolling velocity or slide-roll ratio increases.” 2) Present representative data, not the whole mass of data obtained. This is particularly important if an experiment or set of experiments were repeated several times. 3) If it is necessary to provide more than the representative data, do so in an Appendix, not in the text of your paper. This would also be done for interesting data observed but which otherwise did not affect the outcome of your investigation. If you have a great deal of data to present, do not hesitate to use figures and tables. We use the term display/figure to include charts, diagrams, drawings, and photographs. Rely upon your text to describe your findings, pointing out the most significant and comprehensive findings presented in your displays. The human mind is capable of grasping a great deal of complex information when presented in a graphic than when presented in text. “A picture is worth a thousand words.” While in your text you can point out data that is displayed in a table, do not repeat the data in both places. This redundancy only adds unnecessary bulk to your paper. Findings can be described and commented upon in four different ways: statement of fact, behavior over a range, comparison and contrast, and cause and effect. The following are examples of the former two. Statement of fact: It was verified that the average error in fuel spray droplet size is less than 10%. Behavior over a range: The interface between the saturated and unsaturated regions existed, but did not continue to exist when the water content was increased. The temperature at which the maximum concentration of H-related donor occurs increases slightly with thermal neutron dose. Describe any negative results of your investigation. That is, state what you

Lesson 3 Data Commentary expected to find during your investigation but did not.What an investigation did not uncover often is of as great importance as what was uncovered. Briefly,data commentary goes as follows: Present the subject of the data Make a general comment on the main trend Describe the significant features ● If appropriate,compare/contrast various aspects of the data Conclude by generalizing what you see as the significance in the data performance.This should be based on evidence. I.Recommended reading: pp.91-153in Glasman-Deal,H.(2010).Science Research Writing:For Non-Native Speakers of English.Unit 3 Writing about Results.Imperial College Press. II.Writing the data commentary Generally key elements in data commentary are: location elements and /or summary statements; general/specific highlighting statements; significance,problems,exceptions,etc.in the data. The focus is on highlighting the significant data. Sample Data Commentary: [Location;Summary statement]Table 5 shows the most common modes of infection for U.S businesses. [Specific highlight 1]As can be seen,in the majority of cases,the source of viruses infection can be defected,with disks being brought to the workplace from home being by far the most significant(43%).[Specific highlight 2]However,it is alarming to note that the source of nearly 30%of viruses cannot be determined. [Problem;Significance]While it may be possible to eliminate home-to-workplace infection by requiring computer users to run antiviral software on diskettes brought from home,businesses are still vulnerable to major data loss, especially from unidentifiable sources of infection. 1.Voice Sentence structure Many data commentary sections begin with a sentence containing two elements: location elements and/or summary statements.In English the active voice is as appropriate as the passive voice in this sentence. ·Active voice:: Location Summary ·Table5 shows the most common modes of computer infection for U.S.businesses. Table 2 provides details of the fertilizer used. ·Figure4.2 gives the results of the second experiment. Passive voice: 2/12
Lesson 3 Data Commentary 2 / 12 expected to find during your investigation but did not. What an investigation did not uncover often is of as great importance as what was uncovered. Briefly, data commentary goes as follows: Present the subject of the data Make a general comment on the main trend Describe the significant features If appropriate, compare/contrast various aspects of the data Conclude by generalizing what you see as the significance in the data performance. This should be based on evidence. I. Recommended reading: pp. 91-153 in Glasman-Deal, H. (2010). Science Research Writing: For Non-Native Speakers of English. Unit 3 Writing about Results. Imperial College Press. II. Writing the data commentary Generally key elements in data commentary are: location elements and /or summary statements; general/specific highlighting statements; significance, problems, exceptions, etc. in the data. The focus is on highlighting the significant data. Sample Data Commentary: [Location; Summary statement] Table 5 shows the most common modes of infection for U.S businesses. [Specific highlight 1] As can be seen, in the majority of cases, the source of viruses infection can be defected, with disks being brought to the workplace from home being by far the most significant (43%). [Specific highlight 2]However, it is alarming to note that the source of nearly 30% of viruses cannot be determined. [Problem; Significance] While it may be possible to eliminate home-to-workplace infection by requiring computer users to run antiviral software on diskettes brought from home, businesses are still vulnerable to major data loss, especially from unidentifiable sources of infection. 1. Voice & Sentence structure Many data commentary sections begin with a sentence containing two elements: location elements and/or summary statements. In English the active voice is as appropriate as the passive voice in this sentence. Active voice: Location Summary Table 5 shows the most common modes of computer infection for U.S. businesses. Table 2 provides details of the fertilizer used. Figure 4.2 gives the results of the second experiment. Passive voice:

Lesson 3 Data Commentary Summary location ◆ The most common modes of infection are shown in table 5. Details of the fertilizer used are provided in table 2 The results of the second experiment are given in figure 4.2. 2.Highlighting statements Highlighting statements are generalizations that you draw from the details of the data displayed.It takes good judgment to make a highlighting statement.It is an opportunity to show your intelligence to your readers.In particular,it is an opportunity to demonstrate: that you can spot trends or regularities in the data; that you can separate more important findings from less important ones; that you can make claims of appropriate strength. DO NOT simply repeat all the details in words; attempt to cover all information; claim more than is reasonable or defensible Highlighting statements are usually ordered from general to specific.In other words,major claims are followed by minor claims. 3.Tenses Describe the results of an experiment in the past tense,as the experiment occurred in the past.For findings you conclude from the experiment or your investigation,use the present tense;these are facts which are true now and continue to exist.Mention of figures and tables should be in the present tense;they exist now. 4.High-frequency expressions in data commentary Nouns rise,increase,fall,drop,decrease,fluctuation,downward trend, peak,steep fall,spike,minimum/maximum,local minimum/maximum,linear increase,kink,spike,low point Verb rise,increase,fall,drop,decrease,stabilize,fluctuate,level off Accompanying steady/steadily;sharp;dramatic/dramatically;rapid/rapidly; adjective/adverb slow/slowly; significant/significantly; unexpectedly; noticeable/noticeably Which high-frequency expressions are used in writing the data commentary in your discipline? 5.Terms to refer to Location Inviting your readers to look at an illustration,you have to be able to specify what type of display you refer to,especially when it is not a table. Display Examples Diagrams flow charts,electrical schematics,models(e.g.networks) Illustrations photographs,drawings(e.g.an apparatus/experimental set-up) Maps political,physical,geological maps depicting phenomena 3/12
Lesson 3 Data Commentary 3 / 12 Summary location The most common modes of infection are shown in table 5. Details of the fertilizer used are provided in table 2. The results of the second experiment are given in figure 4.2. 2. Highlighting statements Highlighting statements are generalizations that you draw from the details of the data displayed. It takes good judgment to make a highlighting statement. It is an opportunity to show your intelligence to your readers. In particular, it is an opportunity to demonstrate: that you can spot trends or regularities in the data; that you can separate more important findings from less important ones; that you can make claims of appropriate strength. DO NOT simply repeat all the details in words; attempt to cover all information; claim more than is reasonable or defensible. Highlighting statements are usually ordered from general to specific. In other words, major claims are followed by minor claims. 3. Tenses Describe the results of an experiment in the past tense, as the experiment occurred in the past. For findings you conclude from the experiment or your investigation, use the present tense; these are facts which are true now and continue to exist. Mention of figures and tables should be in the present tense; they exist now. 4. High-frequency expressions in data commentary Nouns rise, increase, fall, drop, decrease, fluctuation, downward trend, peak, steep fall, spike, minimum/maximum, local minimum/maximum, linear increase, kink, spike, low point Verb rise, increase, fall, drop, decrease, stabilize, fluctuate, level off Accompanying adjective/adverb steady/steadily; sharp; dramatic/dramatically; rapid/rapidly; slow/slowly; significant/significantly; unexpectedly; noticeable/noticeably Which high-frequency expressions are used in writing the data commentary in your discipline? 5. Terms to refer to Location Inviting your readers to look at an illustration, you have to be able to specify what type of display you refer to, especially when it is not a table. Display Examples Diagrams flow charts, electrical schematics, models (e.g. networks) Illustrations photographs, drawings (e.g. an apparatus/experimental set-up) Maps political, physical, geological maps depicting phenomena
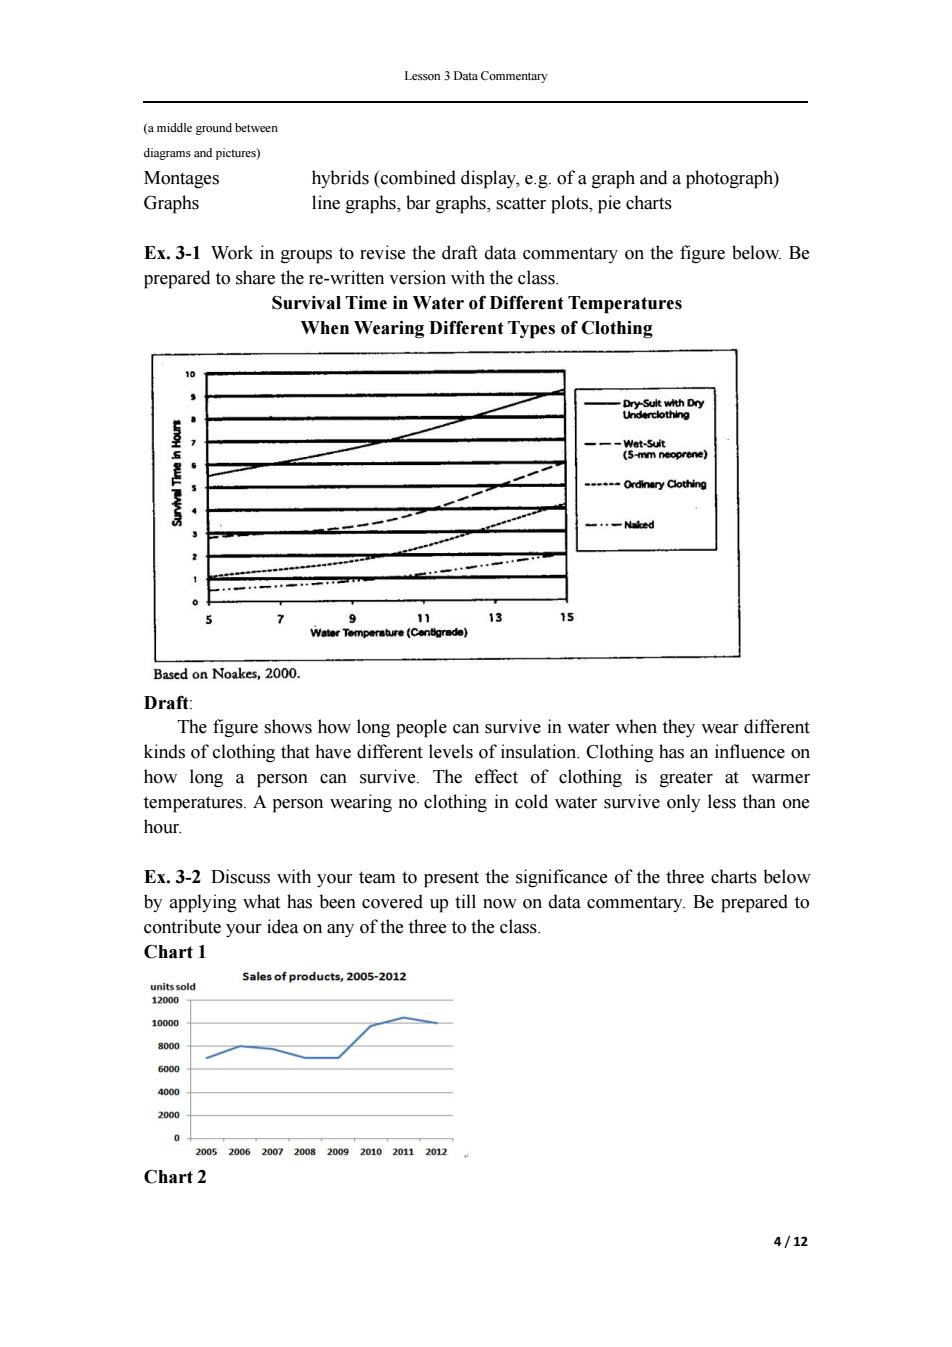
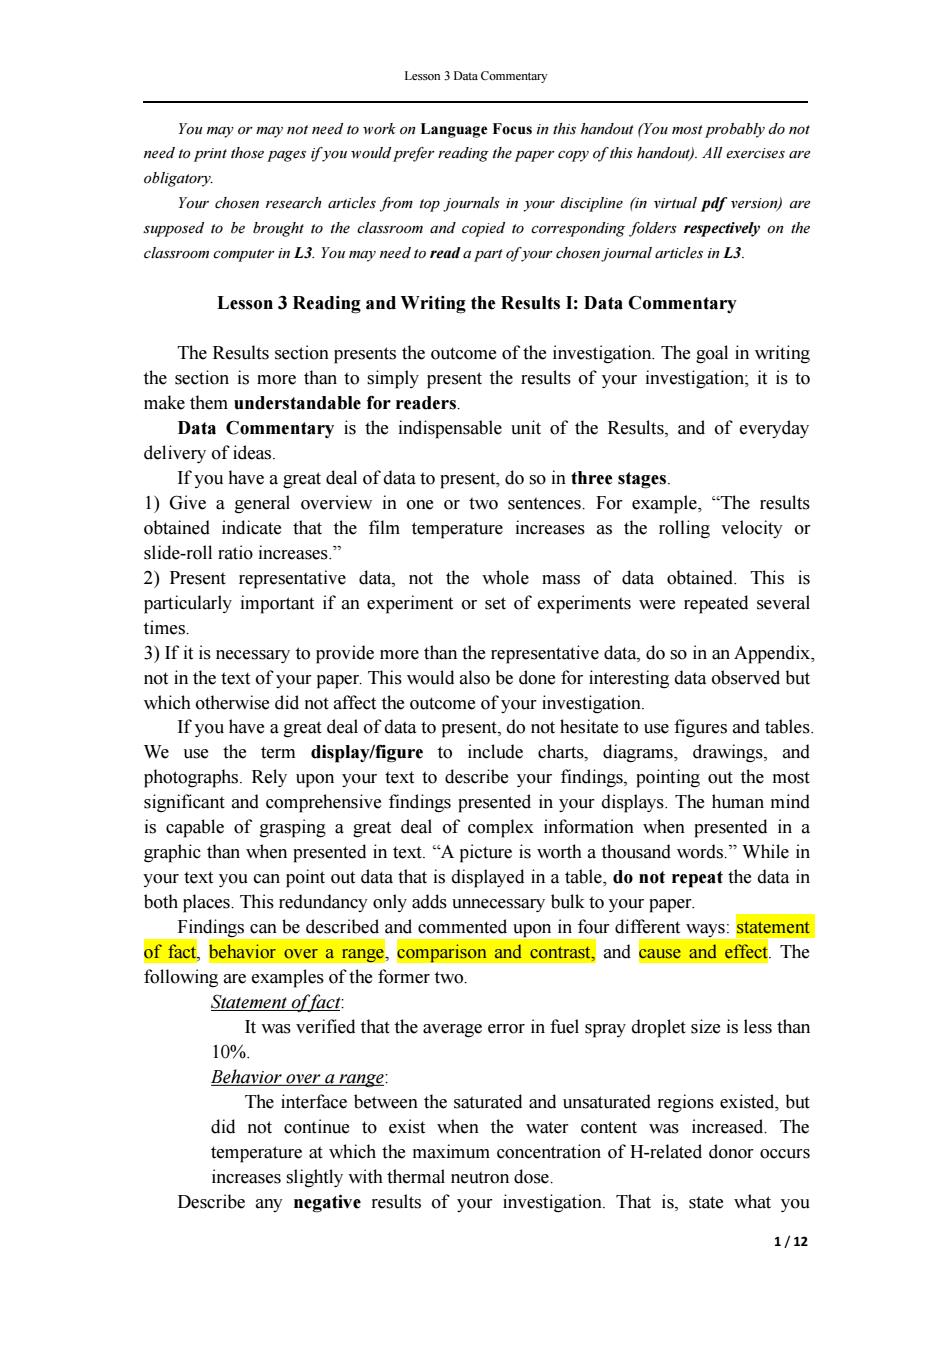
Lesson 3 Data Commentary (a middle ground between diagrams and pictures) Montages hybrids(combined display,e.g.of a graph and a photograph) Graphs line graphs,bar graphs,scatter plots,pie charts Ex.3-1 Work in groups to revise the draft data commentary on the figure below.Be prepared to share the re-written version with the class. Survival Time in Water of Different Temperatures When Wearing Different Types of Clothing 10 Bohr 一-Wat-Sut (5-mm neoprene) +-Ordinary Clothing 9 11 13 15 Based on Noakes,2000. Draft: The figure shows how long people can survive in water when they wear different kinds of clothing that have different levels of insulation.Clothing has an influence on how long a person can survive.The effect of clothing is greater at warmer temperatures.A person wearing no clothing in cold water survive only less than one hour. Ex.3-2 Discuss with your team to present the significance of the three charts below by applying what has been covered up till now on data commentary.Be prepared to contribute your idea on any of the three to the class. Chart 1 Sales of products,2005-2012 unitssold 12000 10000 8000 6000 4000 2000 20052006200720082009201020112012 Chart 2 4/12
Lesson 3 Data Commentary 4 / 12 (a middle ground between diagrams and pictures) Montages hybrids (combined display, e.g. of a graph and a photograph) Graphs line graphs, bar graphs, scatter plots, pie charts Ex. 3-1 Work in groups to revise the draft data commentary on the figure below. Be prepared to share the re-written version with the class. Survival Time in Water of Different Temperatures When Wearing Different Types of Clothing Draft: The figure shows how long people can survive in water when they wear different kinds of clothing that have different levels of insulation. Clothing has an influence on how long a person can survive. The effect of clothing is greater at warmer temperatures. A person wearing no clothing in cold water survive only less than one hour. Ex. 3-2 Discuss with your team to present the significance of the three charts below by applying what has been covered up till now on data commentary. Be prepared to contribute your idea on any of the three to the class. Chart 1 Chart 2
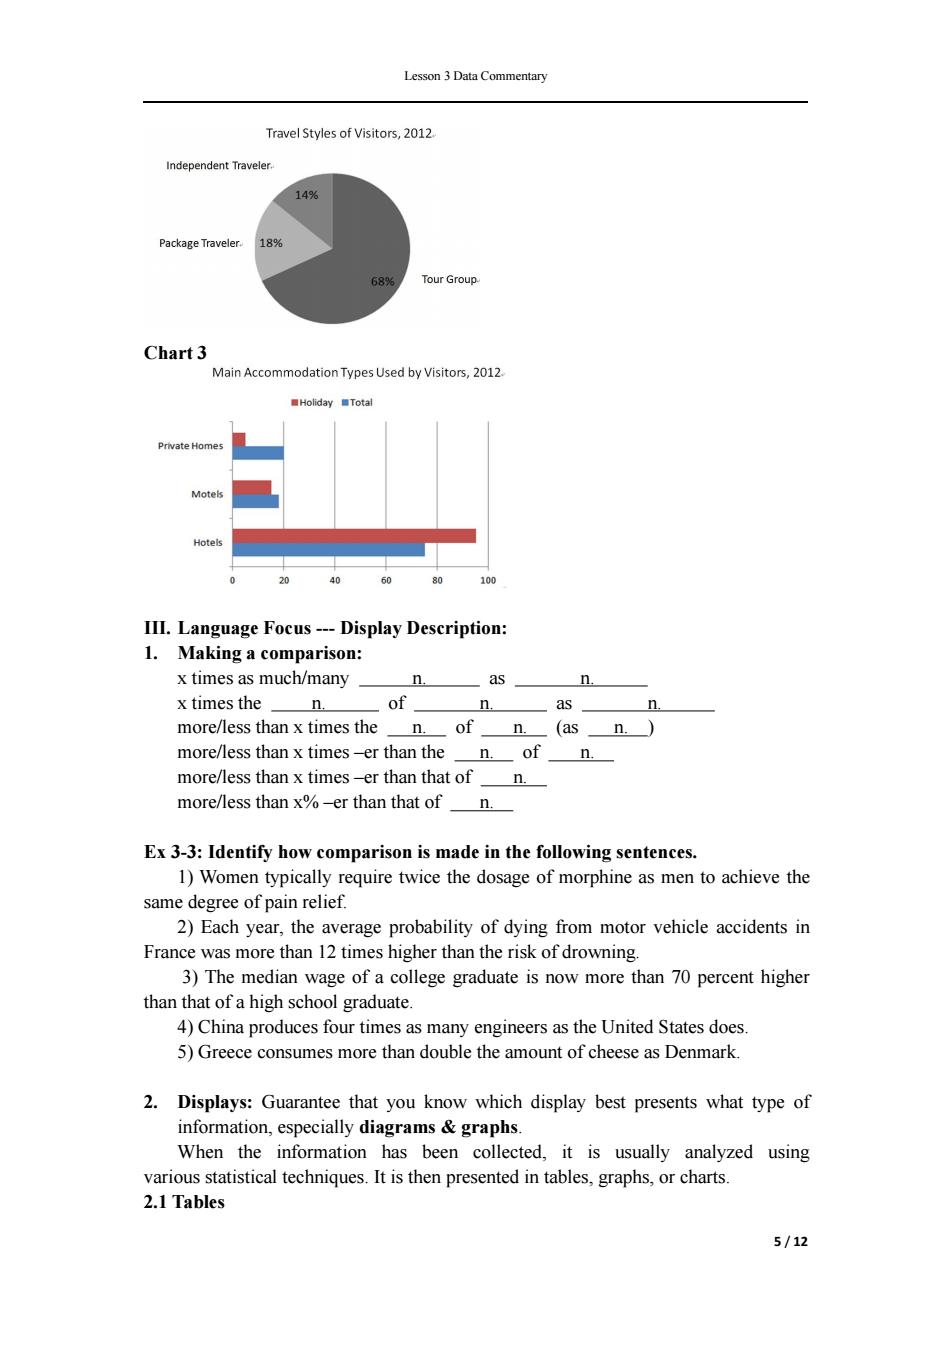
Lesson 3 Data Commentary Travel Styles of Visitors,2012. Independent Traveler. 14% Package Traveler. 18% 68% Tour Group. Chart 3 Main Accommodation Types Used by Visitors,2012. ■Holiday■Tota Private Homes Motels Hotels 40 60 III.Language Focus---Display Description: 1.Making a comparison: x times as much/many n. as n. x times the n. of n. as n more/less than x times the n.of n.(as n. more/less than x times-er than the n.of n. more/less than x times-er than that of n. more/less than x%-er than that of n. Ex 3-3:Identify how comparison is made in the following sentences. 1)Women typically require twice the dosage of morphine as men to achieve the same degree of pain relief. 2)Each year,the average probability of dying from motor vehicle accidents in France was more than 12 times higher than the risk of drowning. 3)The median wage of a college graduate is now more than 70 percent higher than that of a high school graduate. 4)China produces four times as many engineers as the United States does. 5)Greece consumes more than double the amount of cheese as Denmark. 2.Displays:Guarantee that you know which display best presents what type of information,especially diagrams graphs. When the information has been collected,it is usually analyzed using various statistical techniques.It is then presented in tables,graphs,or charts. 2.1 Tables 5/12
Lesson 3 Data Commentary 5 / 12 Chart 3 III. Language Focus --- Display Description: 1. Making a comparison: x times as much/many n. as n. x times the n. of n. as n. more/less than x times the n. of n. (as n. ) more/less than x times –er than the n. of n. more/less than x times –er than that of n. more/less than x% –er than that of n. Ex 3-3: Identify how comparison is made in the following sentences. 1) Women typically require twice the dosage of morphine as men to achieve the same degree of pain relief. 2) Each year, the average probability of dying from motor vehicle accidents in France was more than 12 times higher than the risk of drowning. 3) The median wage of a college graduate is now more than 70 percent higher than that of a high school graduate. 4) China produces four times as many engineers as the United States does. 5) Greece consumes more than double the amount of cheese as Denmark. 2. Displays: Guarantee that you know which display best presents what type of information, especially diagrams & graphs. When the information has been collected, it is usually analyzed using various statistical techniques. It is then presented in tables, graphs, or charts. 2.1 Tables