Survivorship Bias in Performance Studies STOR Stephen J.Brown;William Goetzmann;Roger G.Ibbotson;Stephen A.Ross The Review of Financial Studies,Volume 5,Issue 4(1992),553-580. Stable URL: hutp://links.jstor.org/sici?sici=0893-9454%281992%295%3A4%3C553%3ASBIPS%3E2.0.CO%3B2-I Your use of the JSTOR archive indicates your acceptance of JSTOR's Terms and Conditions of Use,available at http://www.jstor.org/about/terms.html.JSTOR's Terms and Conditions of Use provides,in part,that unless you have obtained prior permission,you may not download an entire issue of a journal or multiple copies of articles,and you may use content in the JSTOR archive only for your personal,non-commercial use. Each copy of any part of a JSTOR transmission must contain the same copyright notice that appears on the screen or printed page of such transmission. The Review of Financial Studies is published by Oxford University Press.Please contact the publisher for further permissions regarding the use of this work.Publisher contact information may be obtained at http://www.jstor.org/journals/oup.html. The Review of Financial Studies 1992 Oxford University Press JSTOR and the JSTOR logo are trademarks of JSTOR,and are Registered in the U.S.Patent and Trademark Office. For more information on JSTOR contact jstor-info@umich.edu. ©2003 JSTOR http://www.jstor.org/ Tue Feb1801:10:002003

Survivorship Bias in Performance Studies Stephen J.Brown New York University William Goetzmann Columbia University Roger G.Ibbotson Stephen A.Ross Yale University Recent evidence suggests tbat past mutual fund performance predicts future performance.We analyze the relationsbip between volatility and returns in a sample that is truncated by survivor- ship and sbow that this relationsbip gives rise to the appearance ofpredictability.We present some numerical examples to sbow that tbis effect can be strong enougb to account for the strengtb of the evidence favoring return predictability. Past performance does not guarantee future perfor- mance.Empirical work from the classic study by Cowles (1933)to work by Jensen(1968)suggests that there is only very limited evidence that professional money managers can outperform the market averages The first-named author acknowledges support of a Yamaichi Faculty Fellow- ship.We thank,for their unusually constructive comments and support Campbell Harvey,Thomas Philips,Richard Roll,the editor (Chester Spatt) the referee (Peter Bossaerts),participants in presentations at Berkeley Columbia,Cornell,New York University,Stanford,University of Massachu- setts at Amherst,Vanderbilt University,Washington University at St.Louis, the 1991 Johnson Symposium at the University of Wisconsin,the Second Conference on Finance and Accounting at the University of Buffalo,1991 and the 1992 Western Finance Association meetings.Remaining errors are our own.Address correspondence to Stephen J.Brown,Department of Finance, Stern School of Business,New York University,44 West 4th St.,New York, NY10012-1126. The Review of Financial Studies 1992 Volume 5,number 4,pp.553-580 1992 The Review of Financial Studies 0893-9454/92/81.50
The Review of Financial Studies /v 5n 4 1992 on a risk-adjusted basis.While more recent evidencel qualifies this negative conclusion somewhat [Grinblatt and Titman (1989),Ippolito (1988)1,there is still no strong evidence that manager performance over and above the market indices can justify the fees managers charge and the commission costs they incur. The fact that managers as a group perform poorly does not preclude the possibility that particular managers have special skills.Given the high turnover of managers,it is conceivable that the market selects out those managers with skills.Skillful managers are those who suc- ceed and survive.It is this view,fostered by annual mutual fund performance reviews of the type published by Barrons,Business Week, Consumer Reports,and other publications,that leads to the popular investment strategy of selling shares in mutual funds that underper- form the average manager in any given year,and buying shares in those funds with superior performance.Despite the popular impres- sion that"hot hands"'exist among mutual funds,there has been very limited empirical evidence to address this issue. Past performance is usually a highly significant input into the deci- sion to hire or fire pension fund money managers.However,Kritzman (1983)reports that for fixed-income pension fund money managers retained for at least 10 years,there is no relationship either in returns or in relative rankings between the performance in the first five years and the second five years.In an unpublished portion of the same study,this finding also extended to equity managers.Similar results are found for institutional funds by Dunn and Theisen (1983)and for commodity funds by Elton,Gruber,and Rentzler (1990).2 In con- trast to these findings,Elton and Gruber(1989,p.602)conclude on the basis of a Securities and Exchange Commission (1971)study that mutual funds which outperform other funds in one period will tend to outperform them in a second.Grinblatt and Titman(1988)suggest that five-year risk-adjusted mutual fund returns do contain some pre- dictive power for subsequent returns.Lehmann and Modest report similar results for the period 1968-1982,but suggest that this finding is sensitive to the method used to compute risk-adjusted performance measures. On the basis of data for the period 1974-1988 both Hendricks, Patel,and Zeckhauser (1991)and Goetzmann and Ibbotson (1991) obtain far stronger results.The first study is limited to 165 equity Some of this evidence is controversial in nature.See Elton et al.(1993)for a discussion of the Ippolito findings :The commodity fund result applies to returns on funds.However,Elton,Gruber,and Rentzler (1990)find evidence of persistence in performance of different funds managed by the same general partner.It would be interesting to discover whether dispersion in risk across surviving managers would suffice to explain this result. 554
Survivorship Bias in Performance Studies funds for the period 1974-1988,while the latter study considers a much larger sample of 728 mutual funds for the period 1976-1988, 258 of which survived for the entire period.The major conclusions of the two studies are similar.Performance persists.3 While the experimental designs and data of these studies differ considerably,the generic results may be illustrated on Tables 1 and 2.The relationship between successive three-year growth equity fund risk-adjusted total returns for the period 1976-1987 is documented in Table 1.The 2 x 2 contingency tables show the frequency with which managers who performed in the top half of all managers [on a Jensen (1968)a risk-adjusted basis]for a given three-year interval also performed in the top half in the subsequent three-year interval. For every period studied,the results are similar.If a manager wins in the first three years,the probability is greater than 50 percent that the manager will win in the second three years.These results are also statistically significant in at least two of the three successive three- year intervals. Goetzmann and Ibbotson (1991)report contingency tables similar to those given in Table 1 for a variety of time periods and performance horizon intervals.The data on which Table 1 is based are similar to those of the Hendricks,Patel,and Zeckhauser (1991)study.An alter- native approach is to regress second-period Jensen's a's against first- period Jensen's a's.A significantly positive slope coefficient is evi- dence of persistence.The result of this exercise is presented in Table 2.The results correspond with those reported in Table 1.The evi- dence of persistence is strongest in the first and third subperiod of the data.Hendricks,Patel,and Zeckhauser (1991)suggest computing the returns on a self-financing portfolio strategy,a methodology they Note that the Kritzman (1983)and Dunn and Theisen (1983)results apply to pension fund money managers,while the other studies that indicate persistence all refer to mutual funds.Representatives from Frank Russell Company and other pension fund consulting companies indicate that efforts to replicate the mutual fund persistence results using pension fund data have to this date been unsuccessful.Part of the reason for this difference might be that mutual fund returns are measured after fees,while pension fund returns typically are measured before commissions (see note 6). One has to be a little careful interpreting the statistical significance of the x'values.The identi. fication of managers as winners or losers is actually ex post.For this reason,we expect to find the winners-following-winners result at least 50 percent of the time.This ex post conditioning also implies that the standard x2 tests (with or without the Yates 2 x 2 continuity correction)will be misspecified.Fortunately,an alternative statistic,the cross-product ratio (given as the ratio of the product of the principal diagonal cell counts to the product of the off-diagonal counts in the 2 x 2 table),has well-known statistical properties.Statisticians prefer the cross-product ratio (or mea- sures closely related to it)because it simultaneously provides a test of the hypothesis that the two classifications are independent,as well as giving a measure of the dependence (Bishop et al.(1975 p.373ff.)]In the present case,row and column,sums of each 2 x 2 contingency table are fixed because of ex post conditioning.Thus,the winner-winner cell count determines all other cell counts,and is distributed as the hypergeometric distribution conditional on row and column counts. Thus,the p-value of the cross-product ratio statistic is given by the sum of hypergeometric prob- abilities of cell counts at least as great as the observed winner-winner count [Agresti (1990,p.60)]. This is known as Fisher's exact test. 555
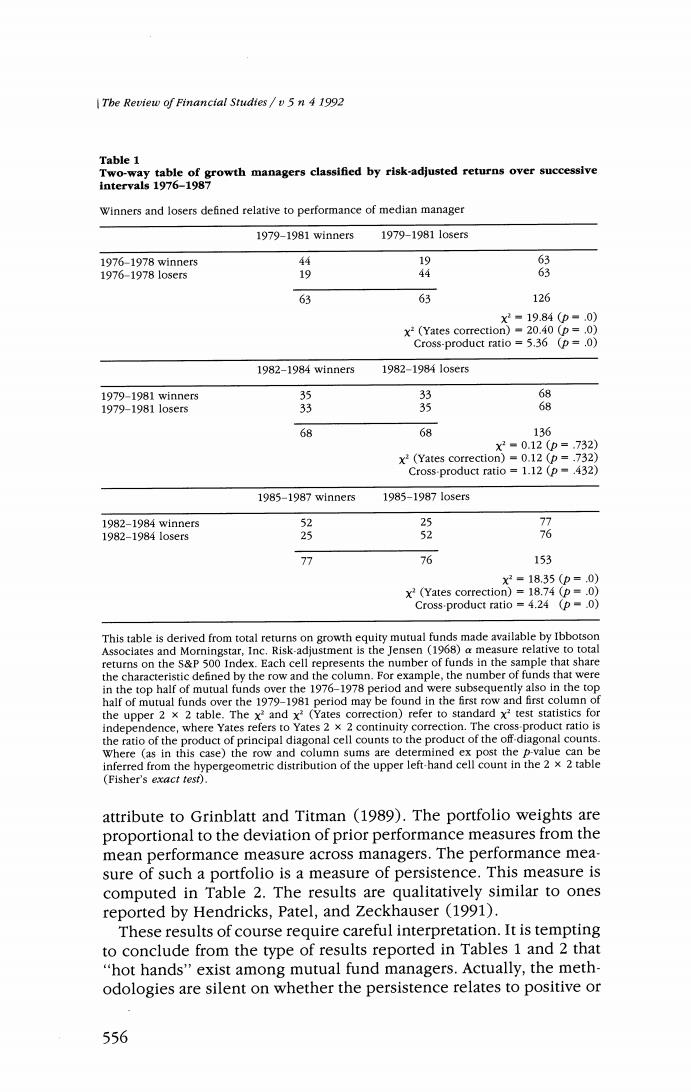
The Review of Financial Studtes/v 5n 4 1992 Table 1 Two-way table of growth managers classified by risk-adjusted returns over successive intervals 1976-1987 Winners and losers defined relative to performance of median manager 1979-1981 winners 1979-19811 osers 1976-1978 winner5 44 19 63 1976-1978105er5 19 63 63 126 X2=19.84(p=.0) x2(Yates correction)=20.40 (p=.0) Cross-product ratio 5.36 (p=.0) 1982-1984 winners 1982-19841o5er5 1979-1981 winners5 35 33 68 1979-19811o5er5 33 35 68 68 68 136 X2■0.12(p=.732) x2(Yates correction)=0.12 (p=.732) Cross-product ratio =1.12(p-.432) 1985-1987 winners 1985-19871 osers 1982-1984 winners 52 5 77 1982-19841 osers 25 52 76 77 76 153 x2=18.35(p=.0) x2(Yates correction)=18.74 (p=.0) Cross-product ratio =4.24 (p=.0) This table is derived from total returns on growth equity mutual funds made available by Ibbotson Associates and Morningstar,Inc.Risk-adjustment is the Jensen (1968)a measure relative to total returns on the s&P 500 Index.Each cell represents the number of funds in the sample that share the characteristic defined by the row and the column.For example,the number of funds that were in the top half of mutual funds over the 1976-1978 period and were subsequently also in the top half of mutual funds over the 1979-1981 period may be found in the first row and first column of the upper 2 x 2 table.The x2 and x?(Yates correction)refer to standard x?test statistics for independence,where Yates refers to Yates 2 x 2 continuity correction.The cross-product ratio is the ratio of the product of principal diagonal cell counts to the product of the off-diagonal counts. Where (as in this case)the row and column sums are determined ex post the p-value can be inferred from the hypergeometric distribution of the upper left-hand cell count in the 2 x 2 table (Fisher's exact test). attribute to Grinblatt and Titman (1989).The portfolio weights are proportional to the deviation of prior performance measures from the mean performance measure across managers.The performance mea- sure of such a portfolio is a measure of persistence.This measure is computed in Table 2.The results are qualitatively similar to ones reported by Hendricks,Patel,and Zeckhauser (1991). These results of course require careful interpretation.It is tempting to conclude from the type of results reported in Tables 1 and 2 that "hot hands"exist among mutual fund managers.Actually,the meth- odologies are silent on whether the persistence relates to positive or 556