第5卷第1期 智能系统学报 Vol.5 No.1 2010年2月 CAAI Transactions on Intelligent Systems Feh.2010 doi:10.3969/j.issn.16734785.2010.01.015 Classification and recognition of image/non-image data based on multinomial logistic regression with nonlinear dimensionality reduction Mudasser NASEER,QIN Shi-yin (School of Automation Science and Electrical Engineering,Beihang University,Beijing 100037,China) Abstract:In pattem classification and recognition oriented to massively complex data most classifiers suffer from the curse of dimensionality.Manifold leaming based nonlinear dimensionality reduction (NLDR)methods provide a good preprocessing to reduce dimensionality before applying any classification method on high dimensional data.Multinomial logistic regression (MLR)can be used to predict the class membership of feature data.In this study several unsupervised NLDR methods are employed to reduce dimensions of the data and the MLR is used for class prediction of image/non-image data so that a new method of classification and recognition oriented to massively complex image/non-image data is proposed based on multinomi- al Logistic regression with nonlinear dimensionality reduction.Through a series of experiments and comparative analysis with supervised NLDR methods for a lot of typical test data the new proposed method is validated to outperform other supervised NLDR ones. Keywords:nonlinear dimensionality reduction;data classification;multinomial logistic regression;image/non-image data CLC Number:TP391 Document code:A Article ID:1673-4785(2010)01-0085-09 Many decision-making problems can be catego-SA)7.These methods fall in the category of unsuper- rized as classification problems.In a number of vised learning and could not be directly used for the practical applications,digital images have been used to purpose of supervised learning of classification.For classifing objects;most examples have dealt with the classification,supervised versions of most of the algo- classification of handwritten numbers,motor vehicle li-rithms such as PCA-LLE and modified supervised LLE cence plates,images of human faces and so on.These (MSLLE)(,supervised LLE(SLLE),Weighte- images contain high dimensional data and require di- dso,supervised Isomap and supervised LT- mensionality reduction before they can be used for clas- SA[3]were introduced from time to time. sification.Recently,a class of nonlinear dimensionali- For this paper,the idea of using unsupervised ty reduction methods,based on the concept of manifold NLDR methods with MLR (U-NLDR MLR)for im- learning,attracted researchers studying dimensionality age data classification was introduced and correspond- reduction for nonlinear images and non-image data. ing comparative analysis of their performance with some Some conventional manifold based learning methods well known supervised versions of NLDR algorithms may be listed as locally linear embedding (LLE)121, was carried out.For experimental and test purposes, Isomap3,Laplacian eigenmaps (LE)4,diffusion some well known grey scale images of handwritten dig- maps(s1,Hessian locally linear embedding its and human faces were used.The performance of va- (HLLE),and local tangent space alignment (LT- rious algorithms was evaluated by classification error rate (ER)for out-of-sample data points. Received Data:2009-08-15. Foundation Item:This work is supported by The Major Program of Hi-tech- 1 Classification nology Research and Development (863)of China. (2008AA12A200 and Programs of National Natural Science Foundation of China (60875072 ) One problem in classification or supervised learn- Corresponding Author:QIN Shi-yin.E-mail:qsy@buaa.edu.cn. ing involves guessing or predicting unknown classes
·86 智能系统学报 第5卷 based on observation.Typically speaking,a set of pat- D =D amax(D)A. terns of features along with a correct classification, Where D is the pairwise distance matrix for combine known as training data,is available.Aftter training, data set,and A equals to 1 if data points are from dif- the task is to classify a new set of patterns,known as ferent classes,and 0 otherwise.Here a (0,1)con- test data.The training data set is assumed to be a ran- trols the amount to which class information should be dom sample from some large population. incorporated.This supervised version of LLE behaves When the dimensionality of input data is relatively as a nonlinear Fisher mapping which controls nonlin- high,most classification methods,such as K-nearest earity. neighbor (K-NN)classifier4),will suffer from the Supervised LTSA also used the idea of artificially curse of dimensionality and produce highly biased esti- increased shift distances between points belonging to mates.Most of the high dimensional data is intrinsical- different classes,but left them unchanged if samples ly low dimensional.Thus,the problem of classification were from the same class.The new pairwise distance can be solved by firstly mapping the high dimensional matrix was given as D'=D+pA,where the shift dis- data into low dimensional subspace by using a suitable tance p is assigned a relatively large value in compari- NLDR method and then applying some classification son with the distance between any pairs of points.A:e- method 9).The above mentioned U-NLDR methods are quals to 1 if data points are from different classes,and not suitable for classification purpose.Some supervised 0 otherwise. versions of these algorithms were developed.In our We chose the above mentioned S-NLDR methods study,we use four supervised NLDR methods-due to their similar approachs of using class informa- WeightedIso,supervised Isomap (S-Isomap),SLLE tion;they increased the distance between data points of and SLTSA. different classes. WeightedIso changed the first step of Isomap.It The S-NLDR methods do not explicitly provide proceeded by first computing the K nearest neighbors of any mapping function for out-of-sample data points, each data point x and denoted Km as the set of nearest and it can be learnt by the estimation methodtis]or by neighbors having the same class label as x.Then it some nonlinear interpolation techniques,such as gen- "moved"each nearest neighbor in Kcloser to by eralized regression networks(GRN).To summa- rescaling their Euclidean distance by a constant factor rize,the general classification procedure has three 1/(>1).Remaining steps of the algorithm re- steps,as follows: main the same as of the unsupervised Isomap. i.Map high dimensional data into a lower dimen- In S-Isomap Euclidean distance d(x;,)is re- sional space using an S-NLDR method. placed by D(,),where ii.Find mapping function for out-of-sample data d( points using an estimation method or GRN. N1-e a D(x,) y:=y分; iii.Map the given query to low dimensional space WeB-a,y:≠y分 using the mapping function and then predict its class The parameter B is used to prevent D(x,)increasing label using K-NN. too fast when d(is relatively large.Usually,t is 2 Multinomial logistic regression set to be the average Euclidean distance between all pairs of data points.The parameter a gives some oppor- Multinomial logistic regression (MLR)is used to tunity to points in different classes to be "more simi- model the relationship between a multiple response var- lar”. iable and one or more predictor variables,which may Among different versions of SLLE,we choose one be either discrete or continuous.Let Ybe a poly- given in the reference,which used the idea of chotomous random variable denoting the outcome of adding distance between samples in different classes as some experiment,and let =(1,2,,)be a
第1期 Classification and recognition of image/non-image data based on multinomial logistic regression with nonlinear dimensionality reduction87 collection of predictor variables.Then the conditional maximum probability. probability of outcome P(Y =1/X)is presented by The flowchart is shown as Fig.1. ()where Input high dimensional imensional π(x)= training data test data exp(B+B1+B2x2+…+B2-l2-1) 1+exp(B+B1出+B,2+…+B-1x-1) Find low dimensional Find low dimensional mapping of test data using If the x are varied and the n values Y,Y2,,Y of Y estimation method are observed,we write Find classification T:= model using MLR exp(B0+B11+B2x2+·+Bp-1p-1) 1+exp(B0+B1xH+B2x2+…+B2-1xp-1) Find classification The problem is now to obtain an estimate of the probability for low dimensional test data vector B=(Bo,B,B1).As the number of signifi- cant predictor variables increases the predicted class Assign low dimensional test data probability becomes more accurate.MLR is a modal to appropriate class based approach and provides classification probability for individual objects as compared to the KNN method, Output classification which gives classification membership.We use U-NLDR error rate methods to map the high dimensional image data into Fig.1 Flowchart of U-NLDR MLR algorithm low dimensional subspace and then use an MLR model to estimate the classification probability for out-of-sam- 3 Performance evaluation ple data points.The low dimensional embedded values are taken as an independent predictor variable.In con- The most commonly used performance evaluation criteria for classification is the ER.If unlimited cases trast,class membership values are taken as values of the dependent variable Y.Since all the NLDR methods for training and testing are available,the error rate is use eigen decomposition,the independence of predictor simply the error rate on the test cases.The simplest variables is obvious.We increase the number of predic- technique for estimating error rates,the holdout meth- tor variables by increasing the dimensions of the embed- ods,is a single training and test experiment.The ded subspace to obtain more accurate estimates of B. sample cases are broken into two groups of cases:a An increase of predictor variables also give rise to the training group and a test group.The classifier is inde- problem of including irrelevant or less important varia- pendently derived from the training cases,and the er- bles in the model.This problem is handled by checking ror estimate is the performance of the classifier on the test cases.A single random partition of training and the significance of the selected model and including the most important or significant predictor variables in the test cases can be somewhat misleading.Random resa- final model. mpling can produce better estimates than a single train and test partition. The procedure is summarized as follows: i.Map high dimensional data into lower dimen- In this study,we used a 10-fold cross validation sional subspace using the U-NLDR method. resampling method to find the error rate.That is,the ii.Apply MLR to find a classification model. original data set was randomly divided into ten equal- iii.Find low dimensional mapping for out-of-sam- sized subsets.Then in each iteration,one subset was ple data points using an estimation method or GRN. used as testing set and the union of the remaining ones was used as the training set.After ten iterations,the iv.Find classification probability for out-of-sample data points by applying the MLR model obtained in average result was taken as the final ER.For Olivitief- (ii),and assign new data points to the class having aces and the Lubeck University face images database
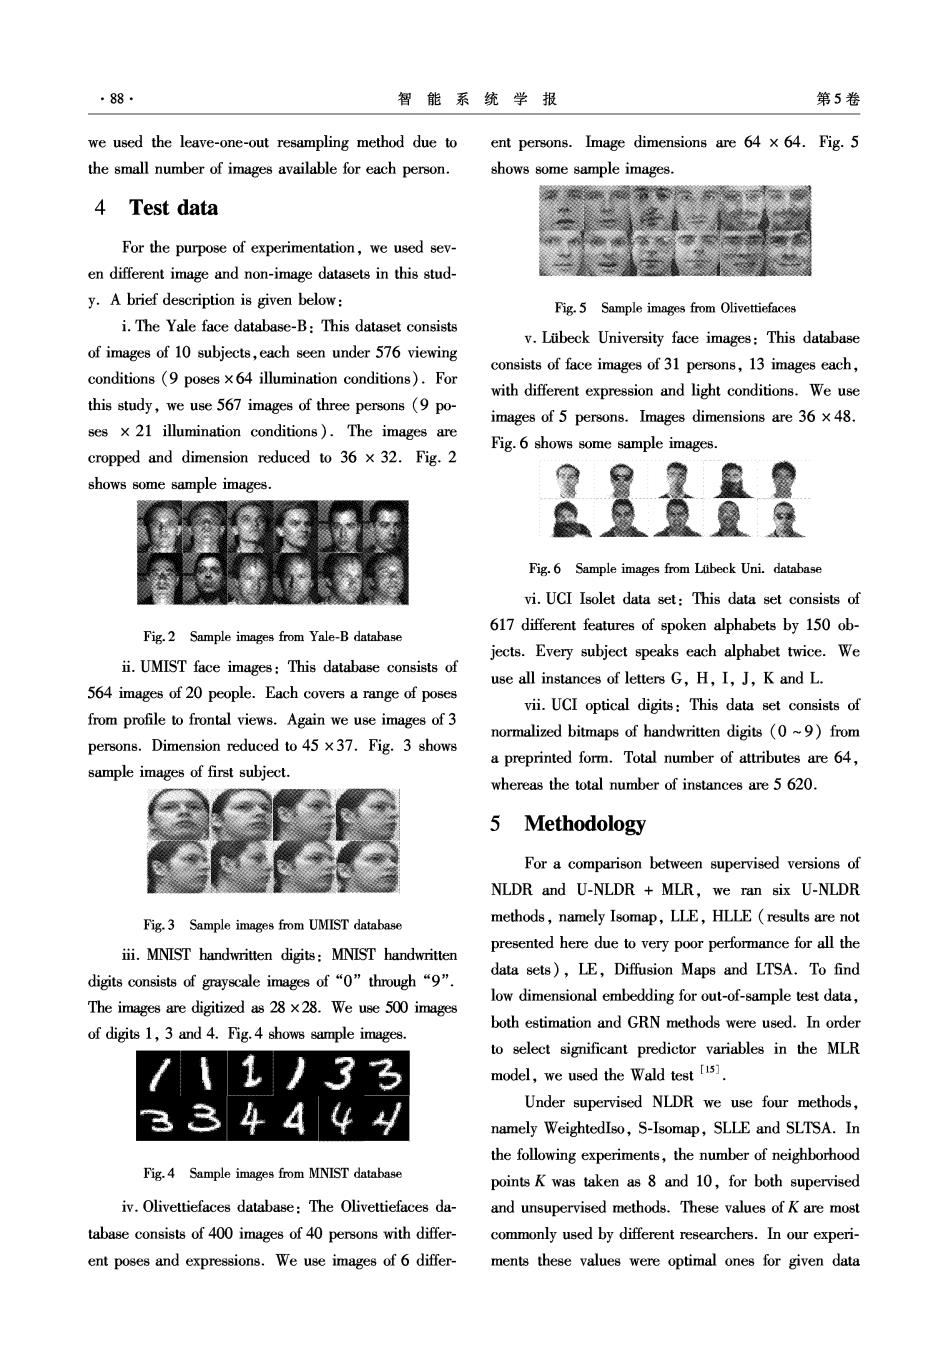
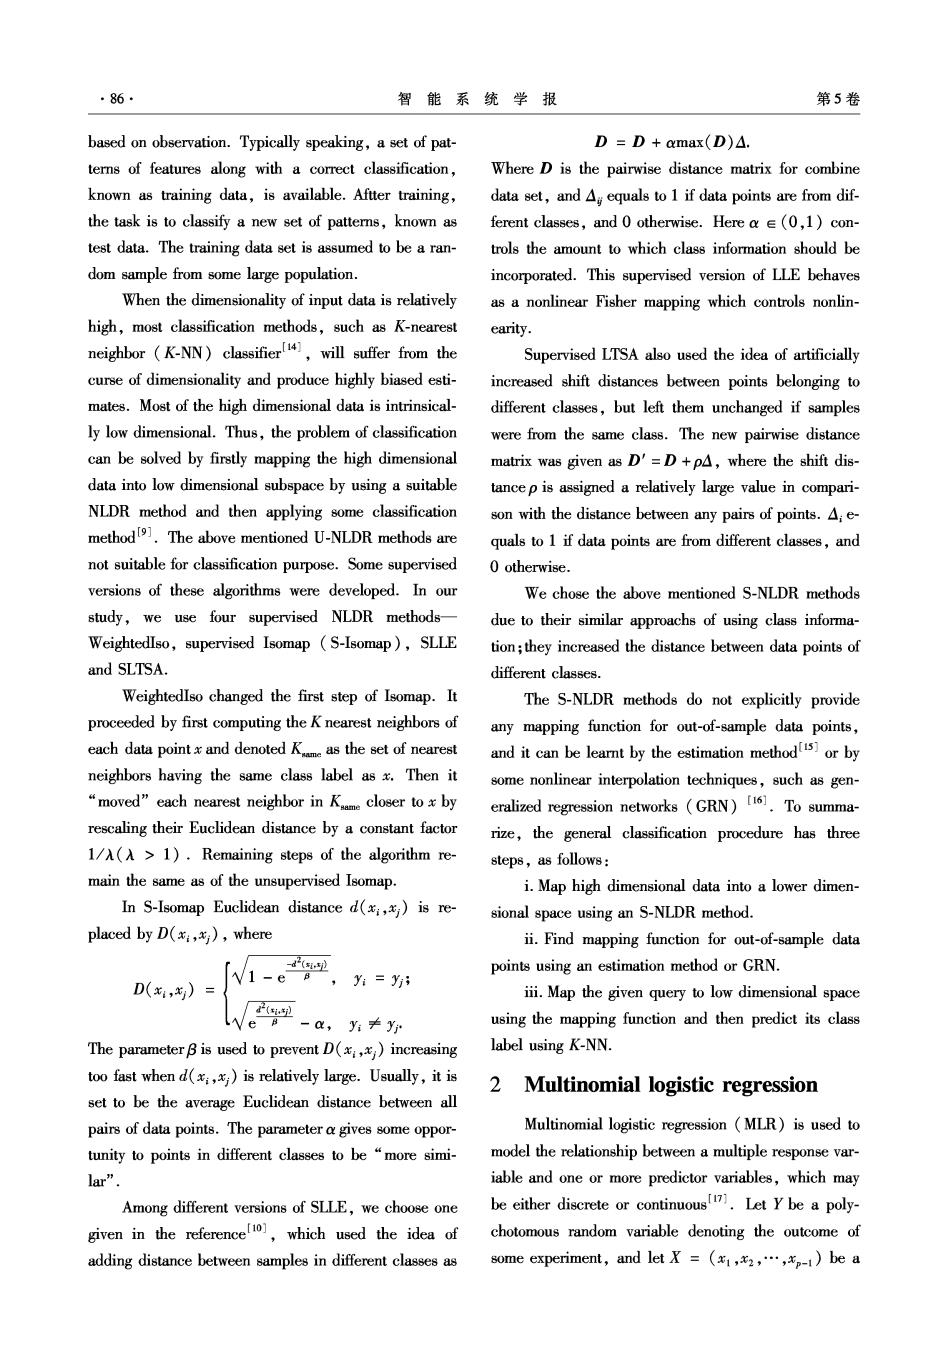
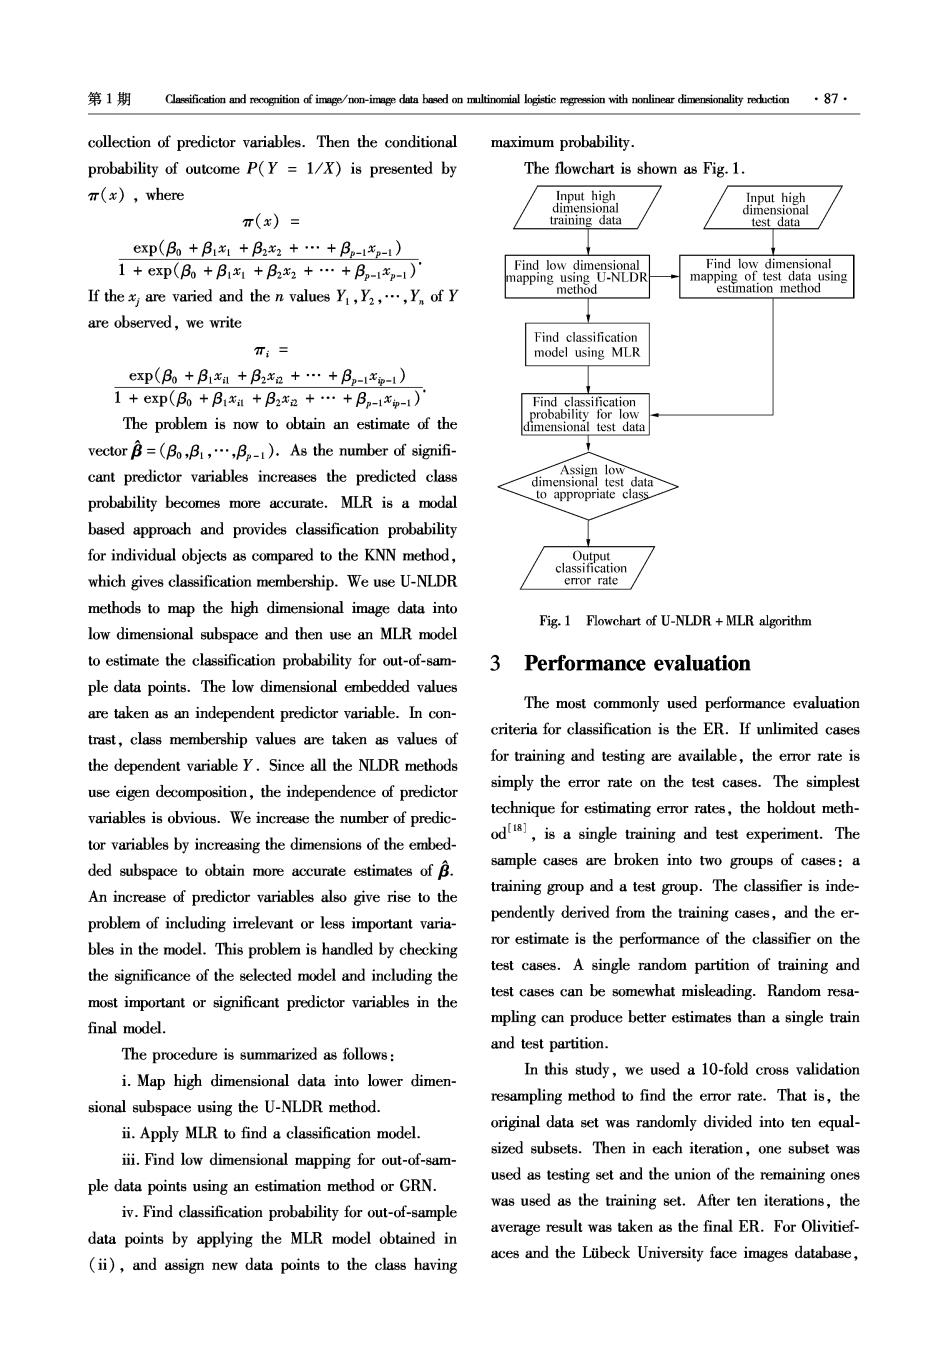
·88 智能系统学报 第5卷 we used the leave-one-out resampling method due to ent persons.Image dimensions are 64 x 64.Fig.5 the small number of images available for each person. shows some sample images. 4 Test data For the purpose of experimentation,we used sev- en different image and non-image datasets in this stud- y.A brief description is given below: Fig.5 Sample images from Olivettiefaces i.The Yale face database-B:This dataset consists v.Lubeck University face images:This database of images of 10 subjects,each seen under 576 viewing consists of face images of 31 persons,13 images each, conditions(9 poses x64 illumination conditions).For with different expression and light conditions.We use this study,we use 567 images of three persons (9 po- images of 5 persons.Images dimensions are 36 x 48. ses x 21 illumination conditions).The images are Fig.6 shows some sample images. cropped and dimension reduced to 36 x 32.Fig.2 shows some sample images Fig.6 Sample images from Lubeck Uni.database vi.UCI Isolet data set:This data set consists of 617 different features of spoken alphabets by 150 ob- Fig.2 Sample images from Yale-B database jects.Every subject speaks each alphabet twice.We ii.UMIST face images:This database consists of use all instances of letters G,H,I,J,K and L. 564 images of 20 people.Each covers a range of poses vii.UCI optical digits:This data set consists of from profile to frontal views.Again we use images of 3 normalized bitmaps of handwritten digits(0~9)from persons.Dimension reduced to 45 x37.Fig.3 shows a preprinted form.Total number of attributes are 64, sample images of first subject. whereas the total number of instances are 5 620. 5 Methodology For a comparison between supervised versions of NLDR and U-NLDR MLR,we ran six U-NLDR Fig.3 Sample images from UMIST database methods,namely Isomap,LLE,HLLE (results are not iii.MNIST handwritten digits:MNIST handwritten presented here due to very poor performance for all the data sets),LE,Diffusion Maps and LTSA.To find digits consists of grayscale images of“0”through“9”. The images are digitized as 28 x28.We use 500 images low dimensional embedding for out-of-sample test data, both estimation and GRN methods were used.In order of digits 1,3 and 4.Fig.4 shows sample images. to select significant predictor variables in the MLR /11)33 model,we used the Wald test [is] 33444 Under supervised NLDR we use four methods, namely WeightedIso,S-Isomap,SLLE and SLTSA.In the following experiments,the number of neighborhood Fig.4 Sample images from MNIST database points K was taken as 8 and 10,for both supervised iv.Olivettiefaces database:The Olivettiefaces da- and unsupervised methods.These values of K are most tabase consists of 400 images of 40 persons with differ- commonly used by different researchers.In our experi- ent poses and expressions.We use images of 6 differ- ments these values were optimal ones for given data
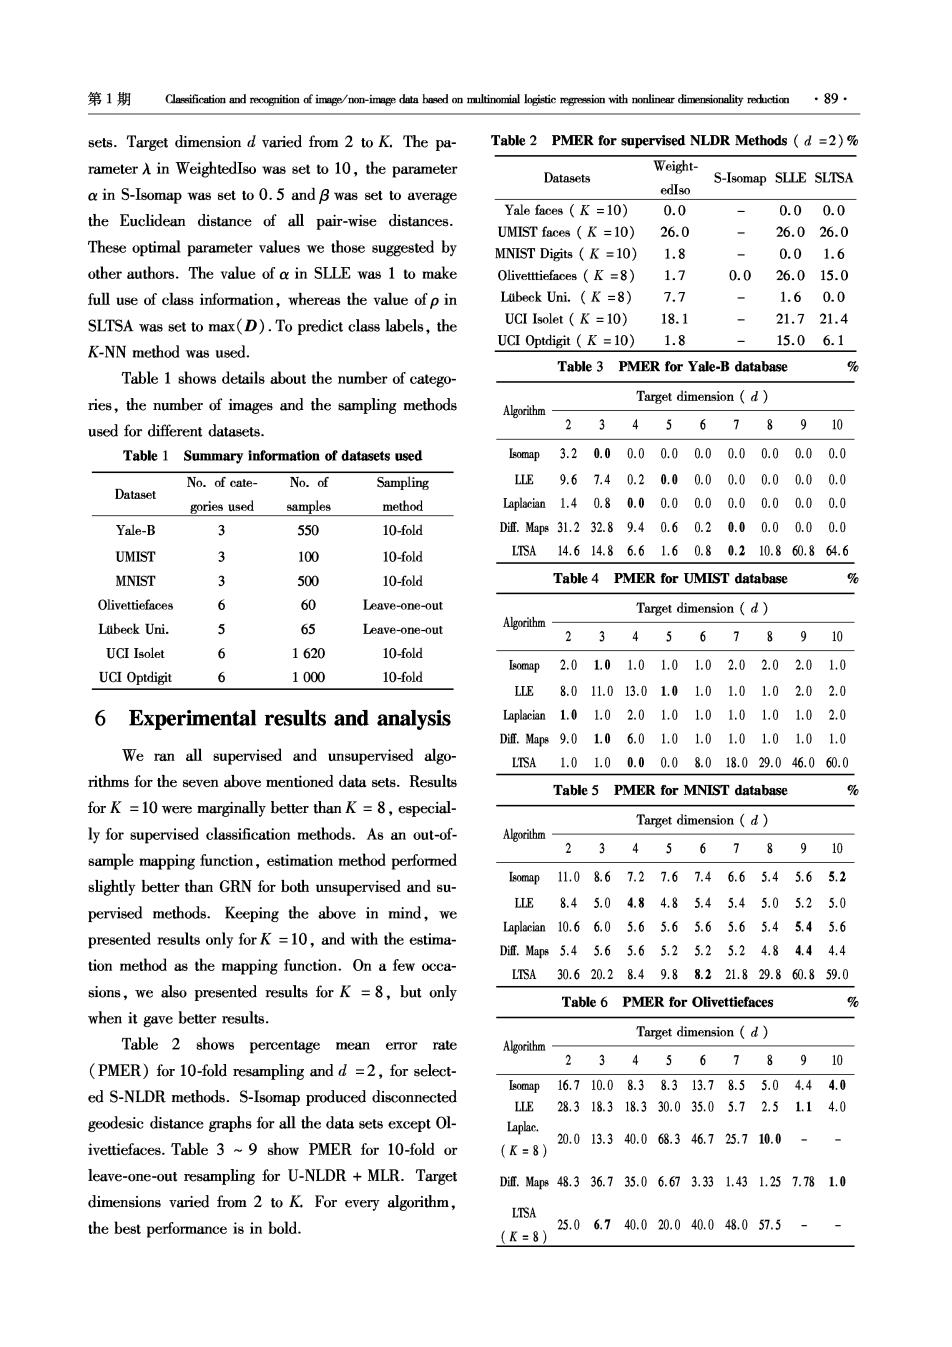
第1期 Classification and recognition of image/non-image data based on multinomial logistic regression with nonlinear dimensionality reduction89 sets.Target dimension d varied from 2 to K.The pa- Table 2 PMER for supervised NLDR Methods (d =2)% rameter A in Weightedlso was set to 10,the parameter Weight- Datasets S-Isomap SLLE SLTSA a in S-Isomap was set to 0.5 and B was set to average edIso Yale faces K =10) 0.0 0.00.0 the Euclidean distance of all pair-wise distances. UMIST faces (K =10) 26.0 26.026.0 These optimal parameter values we those suggested by MNIST Digits K =10) 1.8 0.01.6 other authors.The value of a in SLLE was 1 to make Olivettiefaces (K =8) 1.7 0.026.015.0 full use of class information,whereas the value of p in Ltibeck Uni.(K =8) 7.7 1.60.0 SLTSA was set to max(D).To predict class labels,the UCI Isolet (K =10) 18.1 21.721.4 UCI Optdigit (K =10) 1.8 15.06.1 K-NN method was used. Table 3 PMER for Yale-B database % Table 1 shows details about the number of catego- ries,the number of images and the sampling methods Target dimension (d) Algorithm used for different datasets. 23456789 10 Table 1 Summary information of datasets used map3.20.00.00.00.00.00.00.00.0 No.of cate- No.of Sampling LLE9.67.40.20.00.00.00.00.00.0 Dataset gories used samples method Laplacian1.40.80.00.00.00.00.00.00.0 Yale-B 3 550 10-fold Df.Map831.232.89.40.60.20.00.00.00.0 UMIST 3 100 10-fold LTSA14.614.86.61.60.80.210.860.864.6 MNIST 3 500 10-fold Table 4 PMER for UMIST database % Olivettiefaces 6 60 Leave-one-out Target dimension (d) Lubeck Uni. J 65 Leave-one-out Algorithm 2345678910 UCI Isolet 6 1620 10-fold map2.01.01.01.01.02.02.02.01.0 UCI Optdigit 6 1000 10-fold LLE8.011.013.01.01.01.01.02.02.0 6 Experimental results and analysis Laplacian1.01.02.01.01.01.0.1.01.02.0 Dit.Map89.01.06.01.01.01.01.01.01.0 We ran all supervised and unsupervised algo- LSA1.01.00.00.08.018.029.046.060.0 rithms for the seven above mentioned data sets.Results Table 5 PMER for MNIST database % for K =10 were marginally better than K =8,especial- Target dimension (d) ly for supervised classification methods.As an out-of- 2345678910 sample mapping function,estimation method performed slightly better than GRN for both unsupervised and su- 0map11.08.67.27.67.46.65.45.65.2 LLE 8.45.04.84.85.45.45.05.25.0 pervised methods.Keeping the above in mind,we Laplacian10.66.05.65.65.65.65.45.45.6 presented results only forK=10,and with the estima- Dif.Map85.45.65.65.25.25.24.84.44.4 tion method as the mapping function.On a few occa- LTSA30.620.28.49.88.221.829.860.859.0 sions,we also presented results for K=8,but only Table 6 PMER for Olivettiefaces % when it gave better results. Target dimension (d) Table 2 shows percentage mean error rate Algorithm (PMER)for 10-fold resampling and d =2,for select- 2345678910 ed S-NLDR methods.S-Isomap produced disconnected omp16.710.08.38.313.78.55.04.44.0 L1E28.318.318.330.035.05.72.51.14.0 geodesic distance graphs for all the data sets except Ol- Laplac. 20.013.340.068.346.725.710.0- ivettiefaces.Table 3 ~9 show PMER for 10-fold or (K=8) leave-one-out resampling for U-NLDR MLR.Target Dif.Map848.336.735.06.673.331.431.257.781.0 dimensions varied from 2 to K.For every algorithm, LTSA the best performance is in bold. 25.06.740.020.040.048.057.5 (K=8)