significant:about 88%and 87%of total variance is explained by the regression in 1996 and 2006,respectively.This verifies the good fit and quality of the LMIU data source with official port statistics for analyzing container ports and their position in liner shipping networks. 3.2 Network structure Table 2 highlights important differences between the GDL and GAL approaches and between the two years of observation.In terms of network size,the GDL has fewer links than the GAL,which includes numerous indirect connections among ports,thus making it about 5 times larger(edges)and 12 to 13 times longer than the GDL for the same number of ports (vertices).In the GDL,the most central port in terms of maximum degree value connects about 18 to 19%of all ports;in the GAL,it connects 48 to 51%.Such differences in size have 点 三 a strong influence on other network properties.Indeed,the GAL has about 5 to 6 times greater density,connectivity,and lattice degree compared to the GDL. N 西 More robust measures proposed by physics complement such findings by revealing the polarized or scale-free structure of the GDL with power-law exponents higher than one(-1.35 in 1996 and-1.29 in 2006):few ports concentrate a large number of links (high degree centrality),while most ports have a limited number of links with other ports.Due to its higher density,the GAL is more likely to be a small-world network:higher average clustering -sus] coefficients(0.74 and 0.73),higher transitivity (0.40 and 0.43),lower power-law exponents (-0.62 and-0.65),and smaller diameters (4 and 5)than the GDL indicate the tendency for a given port to have its direct neighbors connected to each other,thus forming tightly connected communities.Thus,the GDL is more representative of hub ports dominating secondary ports, whereas the GAL represents densely connected maritime regions.Consequently,the GAL is more efficient than the GDL,because the inclusion of indirect links facilitates the circulation of flows in the graph,as reflected by its shorter average path length.Our results are similar to those of Hu and Zhu (2009)based on 2006 service data,both for the GDL (power-law exponent of-1.7,average clustering coefficient of 0.4)and the GAL (average clustering coefficient of 0.7).Finally we observe that the network exhibits positive assortative mixing (correlation between the degree centrality of ports and the average degree centrality of their direct neighbours),which confirms that high degree ports tend to connect to high degree ports.This is corroborated by the rich-club coefficients:the density of links per node among 11
11 significant: about 88% and 87% of total variance is explained by the regression in 1996 and 2006, respectively. This verifies the good fit and quality of the LMIU data source with official port statistics for analyzing container ports and their position in liner shipping networks. 3.2 Network structure Table 2 highlights important differences between the GDL and GAL approaches and between the two years of observation. In terms of network size, the GDL has fewer links than the GAL, which includes numerous indirect connections among ports, thus making it about 5 times larger (edges) and 12 to 13 times longer than the GDL for the same number of ports (vertices). In the GDL, the most central port in terms of maximum degree value connects about 18 to 19% of all ports; in the GAL, it connects 48 to 51%. Such differences in size have a strong influence on other network properties. Indeed, the GAL has about 5 to 6 times greater density, connectivity, and lattice degree compared to the GDL. More robust measures proposed by physics complement such findings by revealing the polarized or scale-free structure of the GDL with power-law exponents higher than one (−1.35 in 1996 and −1.29 in 2006): few ports concentrate a large number of links (high degree centrality), while most ports have a limited number of links with other ports. Due to its higher density, the GAL is more likely to be a small-world network: higher average clustering coefficients (0.74 and 0.73), higher transitivity (0.40 and 0.43), lower power-law exponents (−0.62 and −0.65), and smaller diameters (4 and 5) than the GDL indicate the tendency for a given port to have its direct neighbors connected to each other, thus forming tightly connected communities. Thus, the GDL is more representative of hub ports dominating secondary ports, whereas the GAL represents densely connected maritime regions. Consequently, the GAL is more efficient than the GDL, because the inclusion of indirect links facilitates the circulation of flows in the graph, as reflected by its shorter average path length. Our results are similar to those of Hu and Zhu (2009) based on 2006 service data, both for the GDL (power-law exponent of −1.7, average clustering coefficient of 0.4) and the GAL (average clustering coefficient of 0.7). Finally we observe that the network exhibits positive assortative mixing (correlation between the degree centrality of ports and the average degree centrality of their direct neighbours), which confirms that high degree ports tend to connect to high degree ports. This is corroborated by the rich-club coefficients: the density of links per node among halshs-00538051, version 2 - 15 Jul 2012
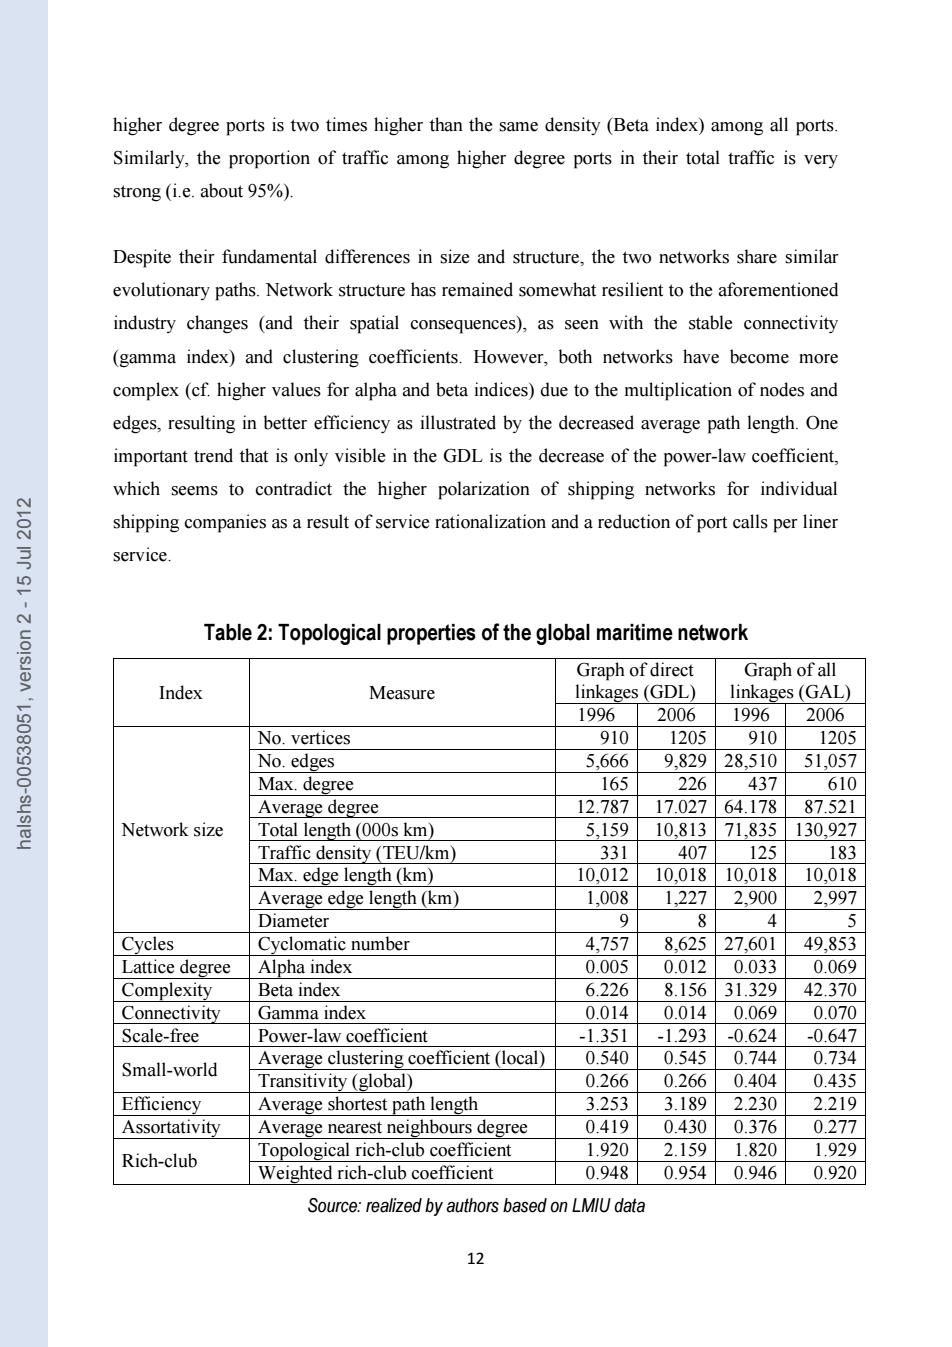
higher degree ports is two times higher than the same density (Beta index)among all ports Similarly,the proportion of traffic among higher degree ports in their total traffic is very strong (i.e.about 95%). Despite their fundamental differences in size and structure,the two networks share similar evolutionary paths.Network structure has remained somewhat resilient to the aforementioned industry changes (and their spatial consequences),as seen with the stable connectivity (gamma index)and clustering coefficients.However,both networks have become more complex(cf.higher values for alpha and beta indices)due to the multiplication of nodes and edges,resulting in better efficiency as illustrated by the decreased average path length.One important trend that is only visible in the GDL is the decrease of the power-law coefficient, which seems to contradict the higher polarization of shipping networks for individual 点 shipping companies as a result of service rationalization and a reduction of port calls per liner service. N Table 2:Topological properties of the global maritime network Graph of direct Graph of all Index Measure linkages(GDL) linkages(GAL) 1996 2006 1996 2006 No.vertices 910 1205 910 1205 No.edges 5,666 9,829 28.510 51,057 Max.degree 165 226 437 610 Average degree 12.787 17.027 64.178 87.521 Network size Total length(000s km) 5,159 10,813 71,835 130,927 Traffic density (TEU/km) 331 407 125 183 Max.edge length(km) 10,012 10,018 10,018 10,018 Average edge length(km) 1,008 1,227 2,900 2,997 Diameter 9 P 4 5 Cycles Cyclomatic number 4,757 8,625 27,601 49,853 Lattice degree Alpha index 0.005 0.012 0.033 0.069 Complexity Beta index 6.226 8.156 31.329 42.370 Connectivity Gamma index 0.014 0.014 0.069 0.070 Scale-free Power-law coefficient -1.351 -1.293 -0.624 -0.647 Small-world Average clustering coefficient (local) 0.540 0.545 0.744 0.734 Transitivity (global) 0.266 0.266 0.404 0.435 Efficiency Average shortest path length 3.253 3.189 2.230 2.219 Assortativity Average nearest neighbours degree 0.419 0.430 0.376 0.277 Rich-club Topological rich-club coefficient 1.920 2.159 1.820 1.929 Weighted rich-club coefficient 0.948 0.954 0.946 0.920 Source:realized by authors based on LMIU data 12
12 higher degree ports is two times higher than the same density (Beta index) among all ports. Similarly, the proportion of traffic among higher degree ports in their total traffic is very strong (i.e. about 95%). Despite their fundamental differences in size and structure, the two networks share similar evolutionary paths. Network structure has remained somewhat resilient to the aforementioned industry changes (and their spatial consequences), as seen with the stable connectivity (gamma index) and clustering coefficients. However, both networks have become more complex (cf. higher values for alpha and beta indices) due to the multiplication of nodes and edges, resulting in better efficiency as illustrated by the decreased average path length. One important trend that is only visible in the GDL is the decrease of the power-law coefficient, which seems to contradict the higher polarization of shipping networks for individual shipping companies as a result of service rationalization and a reduction of port calls per liner service. Table 2: Topological properties of the global maritime network Index Measure Graph of direct linkages (GDL) Graph of all linkages (GAL) 1996 2006 1996 2006 Network size No. vertices 910 1205 910 1205 No. edges 5,666 9,829 28,510 51,057 Max. degree 165 226 437 610 Average degree 12.787 17.027 64.178 87.521 Total length (000s km) 5,159 10,813 71,835 130,927 Traffic density (TEU/km) 331 407 125 183 Max. edge length (km) 10,012 10,018 10,018 10,018 Average edge length (km) 1,008 1,227 2,900 2,997 Diameter 9 8 4 5 Cycles Cyclomatic number 4,757 8,625 27,601 49,853 Lattice degree Alpha index 0.005 0.012 0.033 0.069 Complexity Beta index 6.226 8.156 31.329 42.370 Connectivity Gamma index 0.014 0.014 0.069 0.070 Scale-free Power-law coefficient -1.351 -1.293 -0.624 -0.647 Small-world Average clustering coefficient (local) 0.540 0.545 0.744 0.734 Transitivity (global) 0.266 0.266 0.404 0.435 Efficiency Average shortest path length 3.253 3.189 2.230 2.219 Assortativity Average nearest neighbours degree 0.419 0.430 0.376 0.277 Rich-club Topological rich-club coefficient 1.920 2.159 1.820 1.929 Weighted rich-club coefficient 0.948 0.954 0.946 0.920 Source: realized by authors based on LMIU data halshs-00538051, version 2 - 15 Jul 2012