Fig.13-2:U.S.Current Account and Net Foreign Wealth,1976-2009 Current account, net foreign wealth(billions of dollars) 400 200 Net foreign wealth -200 Current account -400 600 -800 -1000 -1200 -1400 -1600 -1800 -2000 -2200 -2400 -2600 -2800 -3000 -3200 -3400 -3600+ 19761978198019821984198619881990199219941996199820002002200420062008 Source:U.S.Department of Commerce,Bureau of Economic Analysis. 13-11 Copyright2012 Pearson Education.All rights reserved
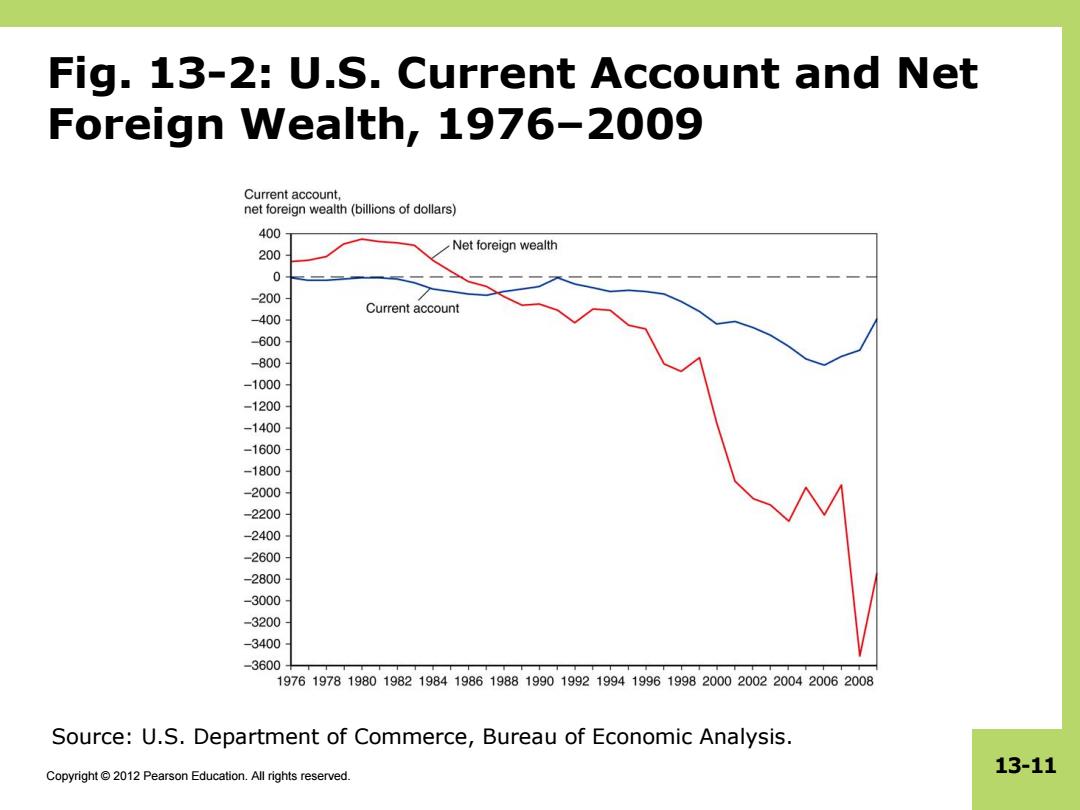
Copyright © 2012 Pearson Education. All rights reserved. 13-11 Fig. 13-2: U.S. Current Account and Net Foreign Wealth, 1976–2009 Source: U.S. Department of Commerce, Bureau of Economic Analysis
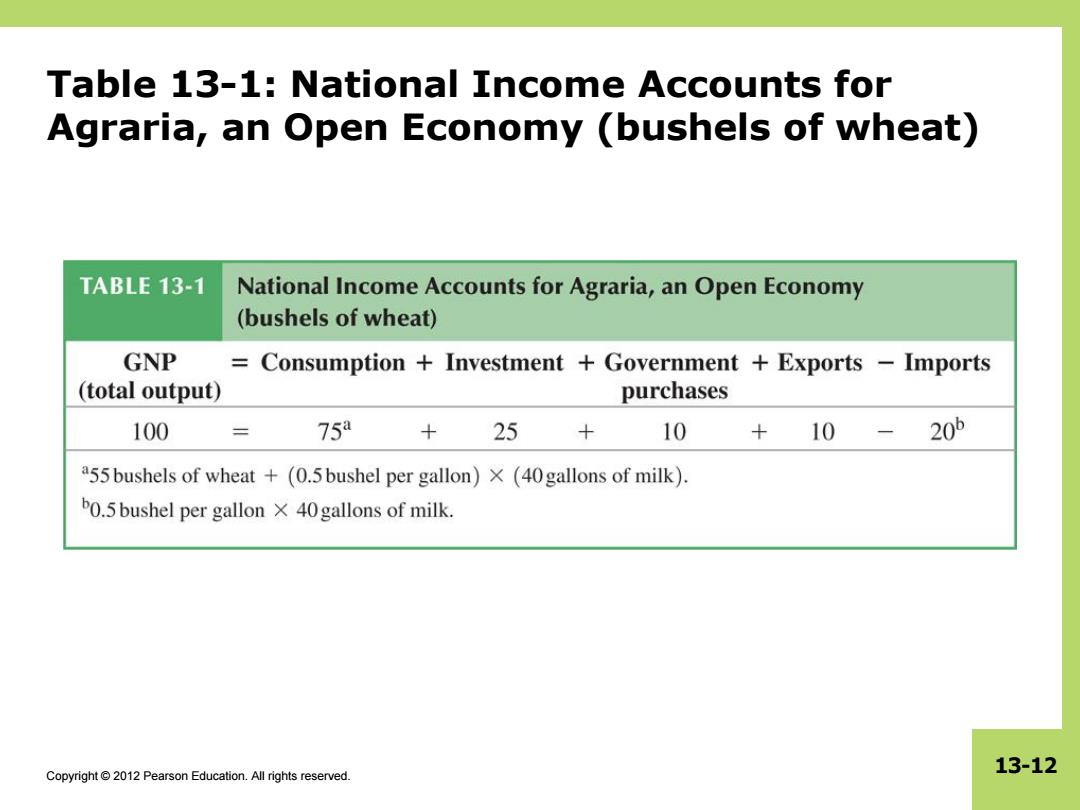
Table 13-1:National Income Accounts for Agraria,an Open Economy (bushels of wheat) TABLE 13-1 National Income Accounts for Agraria,an Open Economy (bushels of wheat) GNP Consumption Investment +Government Exports -Imports (total output) purchases 100 75a + 25 10 10 -20P a55 bushels of wheat +(0.5bushel per gallon)x(40gallons of milk). b0.5bushel per gallon X 40gallons of milk. 13-12 Copyright 2012 Pearson Education.All rights reserved
Copyright © 2012 Pearson Education. All rights reserved. 13-12 Table 13-1: National Income Accounts for Agraria, an Open Economy (bushels of wheat)
Saving and the Current Account National saving (S)=national income (Y)that is not spent on consumption (C)or government purchases (G). S=Y-C-G S=(Y-C-)+(T-G) S=SP Sg 13-13 Copyright2012 Pearson Education.All rights reserved
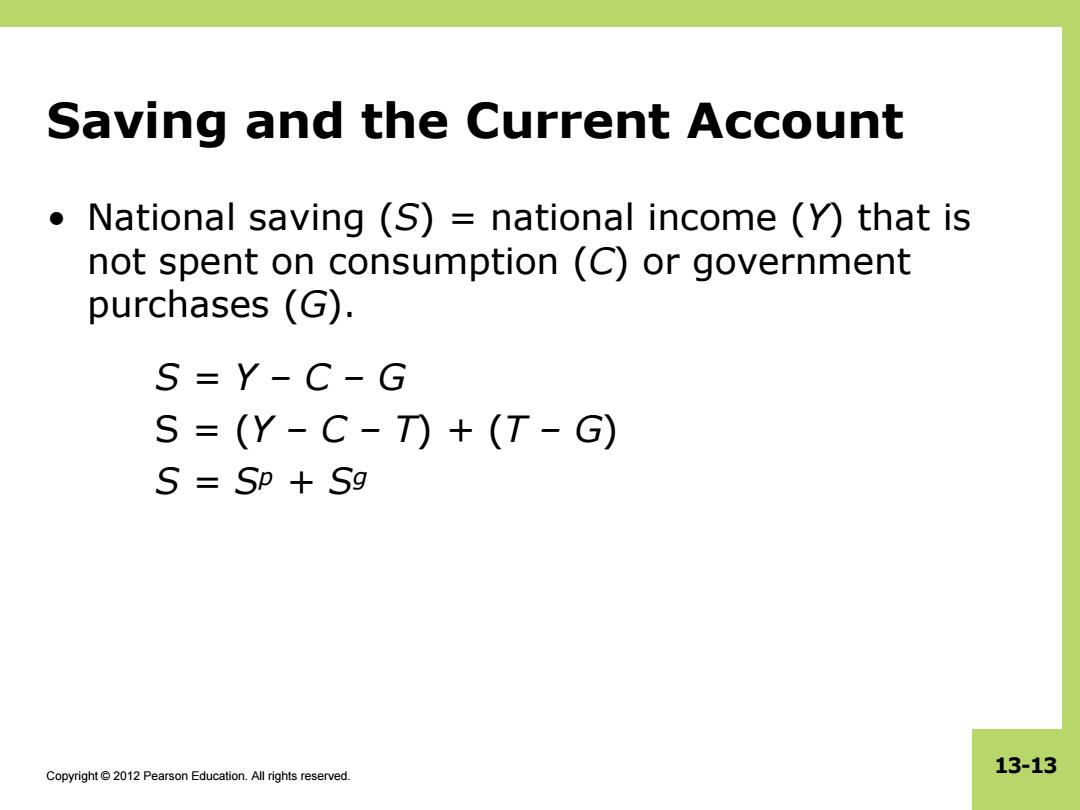
Copyright © 2012 Pearson Education. All rights reserved. 13-13 Saving and the Current Account • National saving (S) = national income (Y) that is not spent on consumption (C) or government purchases (G). S = Y – C – G S = (Y – C – T) + (T – G) S = Sp + Sg