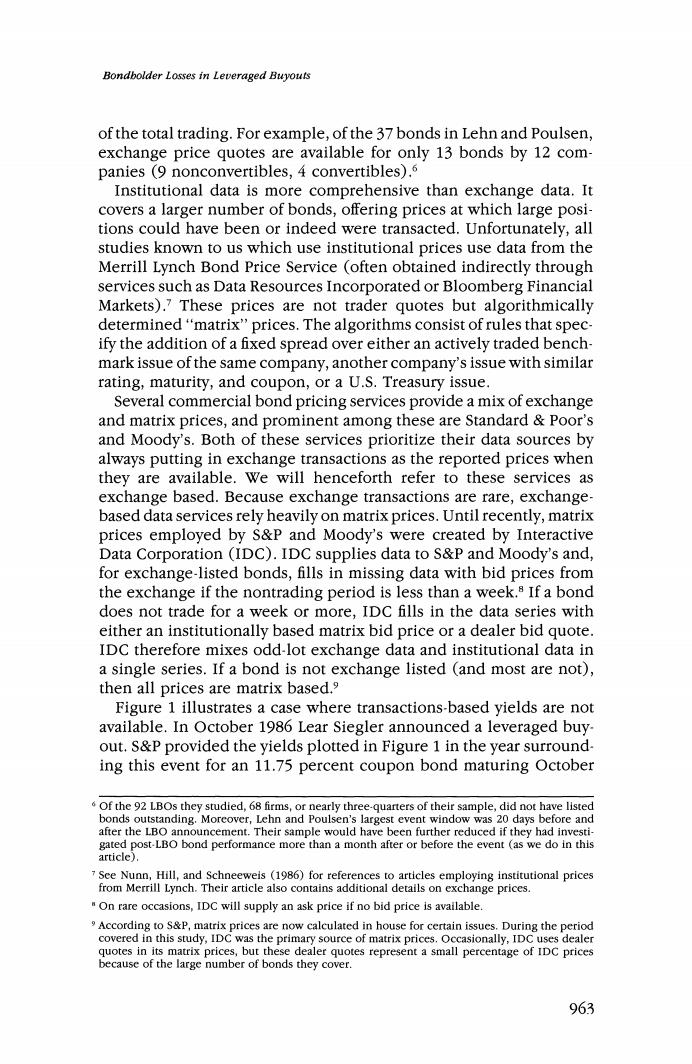
Bondbolder Losses in Leveraged Buyouts of the total trading.For example,of the 37 bonds in Lehn and Poulsen, exchange price quotes are available for only 13 bonds by 12 com- panies (9 nonconvertibles,4 convertibles).6 Institutional data is more comprehensive than exchange data.It covers a larger number of bonds,offering prices at which large posi- tions could have been or indeed were transacted.Unfortunately,all studies known to us which use institutional prices use data from the Merrill Lynch Bond Price Service (often obtained indirectly through services such as Data Resources Incorporated or Bloomberg Financial Markets).7 These prices are not trader quotes but algorithmically determined"matrix"prices.The algorithms consist of rules that spec- ify the addition of a fixed spread over either an actively traded bench- mark issue of the same company,another company's issue with similar rating,maturity,and coupon,or a U.S.Treasury issue. Several commercial bond pricing services provide a mix of exchange and matrix prices,and prominent among these are Standard Poor's and Moody's.Both of these services prioritize their data sources by always putting in exchange transactions as the reported prices when they are available.We will henceforth refer to these services as exchange based.Because exchange transactions are rare,exchange- based data services rely heavily on matrix prices.Until recently,matrix prices employed by s&P and Moody's were created by Interactive Data Corporation (IDC).IDC supplies data to S&P and Moody's and, for exchange-listed bonds,fills in missing data with bid prices from the exchange if the nontrading period is less than a week.If a bond does not trade for a week or more,IDC fills in the data series with either an institutionally based matrix bid price or a dealer bid quote. IDC therefore mixes odd-lot exchange data and institutional data in a single series.If a bond is not exchange listed (and most are not), then all prices are matrix based. Figure 1 illustrates a case where transactions-based yields are not available.In October 1986 Lear Siegler announced a leveraged buy. out.S&P provided the yields plotted in Figure 1 in the year surround- ing this event for an 11.75 percent coupon bond maturing October Of the 92 LBOs they studied,68 firms,or nearly three-quarters of their sample,did not have listed bonds outstanding.Moreover,Lehn and Poulsen's largest event window was 20 days before and after the LBO announcement.Their sample would have been further reduced if they had investi- gated post-LBO bond performance more than a month after or before the event (as we do in this article). 7 See Nunn,Hill,and Schneeweis (1986)for references to articles employing institutional prices from Merrill Lynch.Their article also contains additional details on exchange prices. "On rare occasions,IDC will supply an ask price if no bid price is available. According to s&P,matrix prices are now calculated in house for certain issues.During the period covered in this study,IDC was the primary source of matrix prices.Occasionally,IDC uses dealer quotes in its matrix prices,but these dealer quotes represent a small percentage of IDC prices because of the large number of bonds they cover. 963

Tbe Review of Financial Studies/v 6 n 4 1993 12 Lehman Brothers Trader Quoles S&P Bond Guide (Matrix Prices) 9 Govemment/Corporale Index 5】 32-101 Announcement Month (0=October 1986) Figure 1 Yield reaction around Lear Siegler LBO announcement for 11%percent bond of 10/91 The Government/Corporate Index benchmark series combines Lehman Brothers Government and Corporate Bond Indexes.The Corporate Bond Index includes all public,fixed-rate,nonconvertible investment-grade debt.The Government Bond Index includes all U.S.Government guaranteed bonds and notes excluding flower bonds and foreign-targeted issues.Bonds must have a minimum outstanding principal of $25 million and a minimum maturity of one year to quality for any Lehman Brothers bond index. 1991.We collected in-house trader-quoted bid yields from Lehman Brothers (further described in Section B)around this event to match with the s&P yields,and both series are plotted.We also provide the yields to Lehman Brothers'combined Intermediate Term Corporate/ Government Bond Index,which is a commonly used benchmark for gauging bond market performance.Although we are not privy to the exact index or bond that IDC uses to matrix price the Lear Siegler bond,it appears that the bond's matrix-based prices track the Lehman Brothers Corporate/Government Index fairly well.The S&P data exhibit virtually no change around the event,whereas the trader- quoted yields from Lehman Brothers indicate a 200-basis-point increase in yield (and a corresponding decrease in the price Lehman Brothers was willing to pay for the bond).It is the absence of independent movement in the s&P data at the LBO announcement date that sug- gests the prices reported for the bond by s&P (and created by IDC) are just fixed spreads off of some index or more actively traded U.S. Treasury issue. In an article on corporate buyouts,Asquith and Wizman (1990) found that 46 bonds of companies involved in successful LBOs have 964
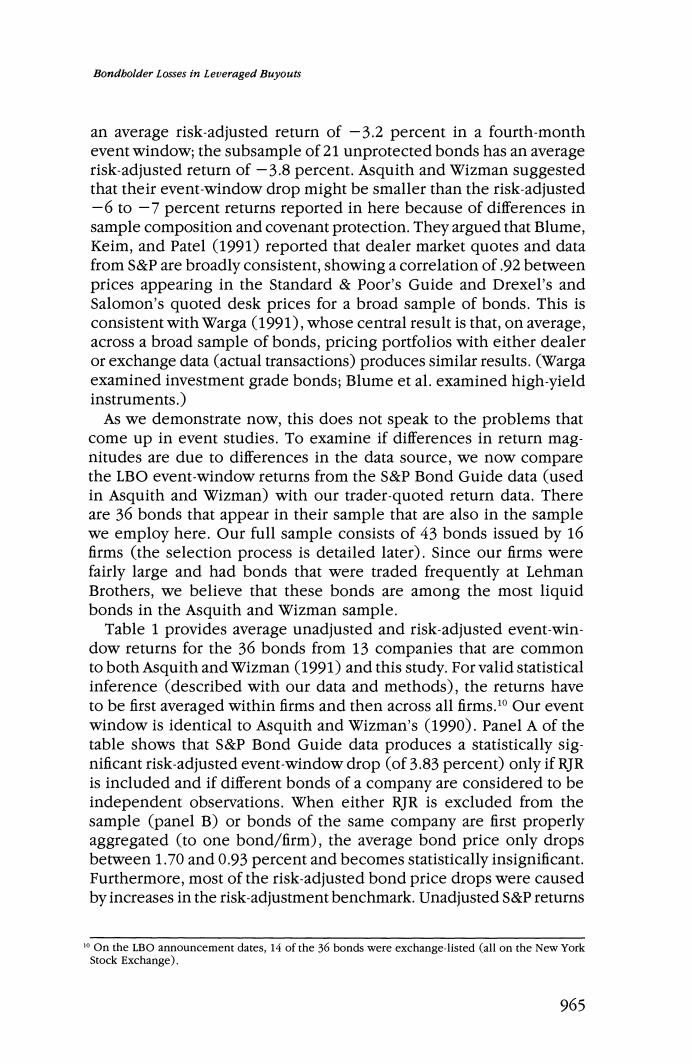
Bondbolder Losses in Leveraged Buyouts an average risk-adjusted return of -3.2 percent in a fourth-month event window;the subsample of 21 unprotected bonds has an average risk-adjusted return of-3.8 percent.Asquith and Wizman suggested that their event-window drop might be smaller than the risk-adjusted -6 to-7 percent returns reported in here because of differences in sample composition and covenant protection.They argued that Blume, Keim,and Patel (1991)reported that dealer market quotes and data from S&P are broadly consistent,showing a correlation of.92 between prices appearing in the Standard Poor's Guide and Drexel's and Salomon's quoted desk prices for a broad sample of bonds.This is consistent with Warga(1991),whose central result is that,on average, across a broad sample of bonds,pricing portfolios with either dealer or exchange data (actual transactions)produces similar results.(Warga examined investment grade bonds;Blume et al.examined high-yield instruments.) As we demonstrate now,this does not speak to the problems that come up in event studies.To examine if differences in return mag- nitudes are due to differences in the data source,we now compare the LBO event-window returns from the S&P Bond Guide data (used in Asquith and Wizman)with our trader-quoted return data.There are 36 bonds that appear in their sample that are also in the sample we employ here.Our full sample consists of 43 bonds issued by 16 firms (the selection process is detailed later).Since our firms were fairly large and had bonds that were traded frequently at Lehman Brothers,we believe that these bonds are among the most liquid bonds in the Asquith and Wizman sample. Table 1 provides average unadjusted and risk-adjusted event-win- dow returns for the 36 bonds from 13 companies that are common to both Asquith and Wizman (1991)and this study.For valid statistical inference (described with our data and methods),the returns have to be first averaged within firms and then across all firms.10 Our event window is identical to Asquith and Wizman's (1990).Panel A of the table shows that S&P Bond Guide data produces a statistically sig- nificant risk-adjusted event-window drop (of 3.83 percent)only if RJR is included and if different bonds of a company are considered to be independent observations.When either RJR is excluded from the sample (panel B)or bonds of the same company are first properly aggregated (to one bond/firm),the average bond price only drops between 1.70 and 0.93 percent and becomes statistically insignificant. Furthermore,most of the risk-adjusted bond price drops were caused by increases in the risk-adjustment benchmark.Unadjusted S&P returns On the LBO announcement dates,14 of the 36 bonds were exchange-listed (all on the New York Stock Exchange). 965

Tbe Revtew of Financial Studies /v 6n 4 1993 Table 1 Returns from four-month event window for both trader-quote data and s&P bond guide data Trader quote S&P bond guide DTRET DTRETR DTRET DTRETR A:With RJR Nabisco bonds One bond/firm,N=13 Mean -2.75% -6.55% 2.03% -1.70% (-1.06) (-2.78) (1,74) (-1.17) All Bonds,N=36 Mean -4.60% -7.33% -1.10% -3.83% (-3.65) (-5.62) (-1.14) (-3.25) B:Without RJR Nabisco bonds One bond/firm,N=12 Mean -2.32% -6.18% 2.63% -1.14% (-0.84) (-2.44) (2.45) (-0.78) All bonds,N=22 Mean -2.50% -5.00% 1.55% -0.93% (-1.41) (-2.80) (1.38) (-0.62) f-statistics are in parentheses below the coefficients.The 36 bonds from 13 companies examined here represent all bonds traded at Lehman Brothers over the period January 1985 through April 1989 that have both a consecutive time series of dealer quotes available and prices reported in the S&P Bond Guide around the month of the buyout announcement.Risk-adjusted bond returns (DTRETR)are calculated by subtracting from the raw bond return(DTRET)the return of an index with rating and maturity characteristics similar to the bond of interest.The "adjustment"index was constructed from eight Lehman Brothers Corporate Bond indexes by linear interpolation of the two closest indexes in the dimensions of rating and maturity (again,bonds outside the available range of characteristics are benchmarked against the closest index).Under the null hypothesis that LBOs had no effect,the average risk-adjusted debt return should be zero.The event-window returns are calculated from the month-end two months preceding an LBO announcement to the end of the second month following it.For example,if the LBO announcement is March 20,the returns are calculated over February,March,April,and May.One bond/firm means that values are averaged first within firm and then across firms.Trader-quote data are from Lehman Brothers,and exchange-based data are from the S&P Bond Guide. are at best statistically insignificantly negative,at worst statistically significantly positive.In contrast,in this article the risk-adjusted trader- quoted return drops are considerably larger,ranging from 5.00 to 7.30 percent,and always statistically significant.Even unadjusted returns are always negative,ranging from -2.32 to -4.60 percent,although the unadjusted drops are only statistically significant when we include all 36 bonds as independent observations. Panel B of Table 1 presents the same information as panel A but with all 14 RJR bonds excluded from the analysis.Risk-adjusted returns from trader-quote data again reveal significant losses,but none are provided by the S&P data.It is noteworthy that the only significant figure in the s&P data in panel B is a positive unadjusted debt return on a firm-by-firm basis. Note that not all exchange data respond slowly.We can illustrate this with two Federated Department Store bonds that are exchange 966