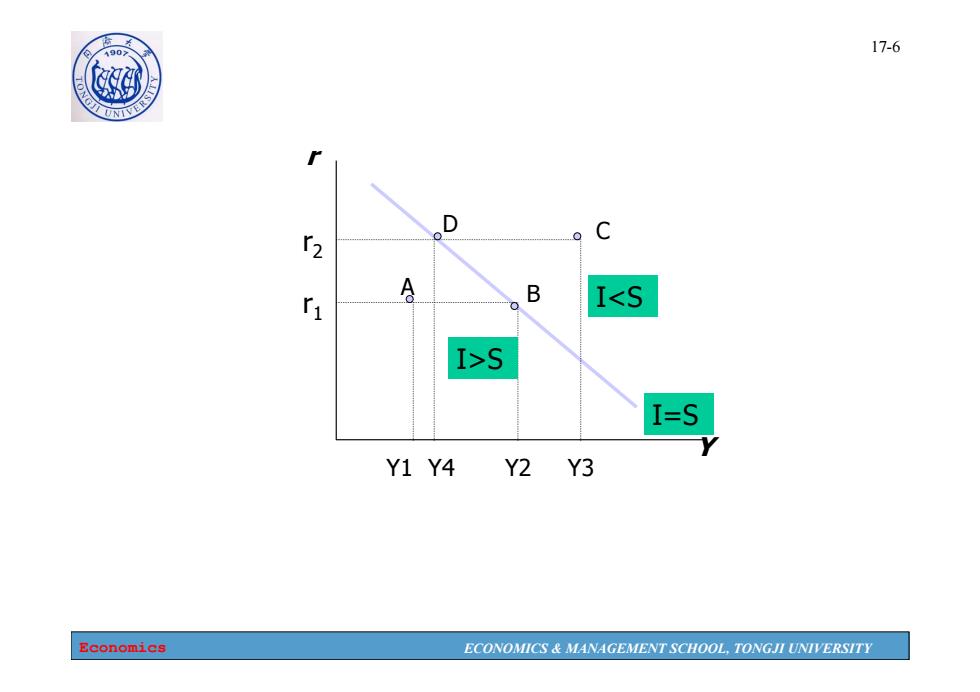
190 17-6 D C B I<S I>S I-S Y1 Y4 Y2 Y3 Economics ECONOMICS MANAGEMENT SCHOOL,TONGJI UNIVERSITY
Economics ECONOMICS & MANAGEMENT SCHOOL, TONGJI UNIVERSITY 17-6 r Y A B D C Y1 Y2 Y3 Y4 r1 r2 I<S I>S I=S
190 17-7 Understanding the IS curve's slope Equilibrium in the goods market implies that an increase in the interest rate leads to a decrease in output.The IS curve is downward sloping. The Is curve is negatively sloped. ·Intuition: A fall in the interest rate motivates firms to increase investment spending,which drives up total planned spending (AE). To restore equilibrium in the goods market,output (a.k.a.actual expenditure,r)must increase. Economics ECONOMICS MANAGEMENT SCHOOL,TONGJI UNIVERSITY
Economics ECONOMICS & MANAGEMENT SCHOOL, TONGJI UNIVERSITY 17-7 Understanding the IS curve’s slope • Equilibrium in the goods market implies that an increase in the interest rate leads to a decrease in output. The IS curve is downward sloping. • The IS curve is negatively sloped. • Intuition: A fall in the interest rate motivates firms to increase investment spending, which drives up total planned spending (AE ). To restore equilibrium in the goods market, output (a.k.a. actual expenditure, Y ) must increase
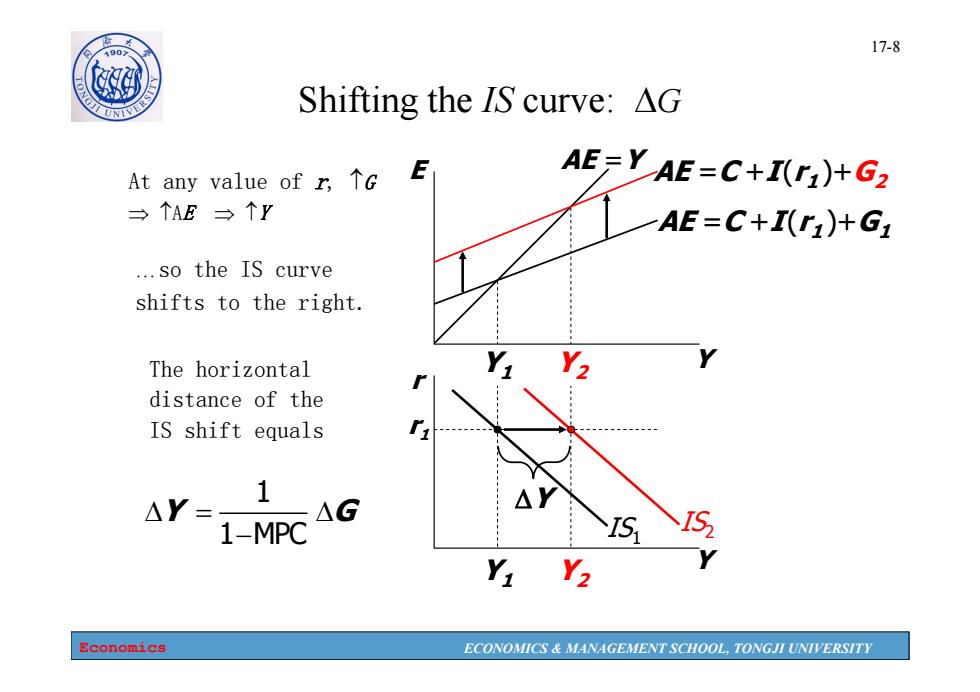
17-8 Shifting the IS curve:AG At any value of r,↑G AE=Y AE=C+I(r)+G2 →个AE三个Y AE=C+I()+G ...so the IS curve shifts to the right. The horizontal Y2 distance of the IS shift equals 1 △Y= ΔG 1-MPC IS Y Y2 Economics ECONOMICS MANAGEMENT SCHOOL,TONGJI UNIVERSITY
Economics ECONOMICS & MANAGEMENT SCHOOL, TONGJI UNIVERSITY 17-8 Y1 Y2 Y1 Y2 Shifting the IS curve: G At any value of r, G AE Y Y E r Y AE =C +I (r1)+G1 AE =C +I (r1)+G2 r1 AE =Y IS1 The horizontal distance of the IS shift equals IS2 …so the IS curve shifts to the right. 1 1 MPC Y G Y
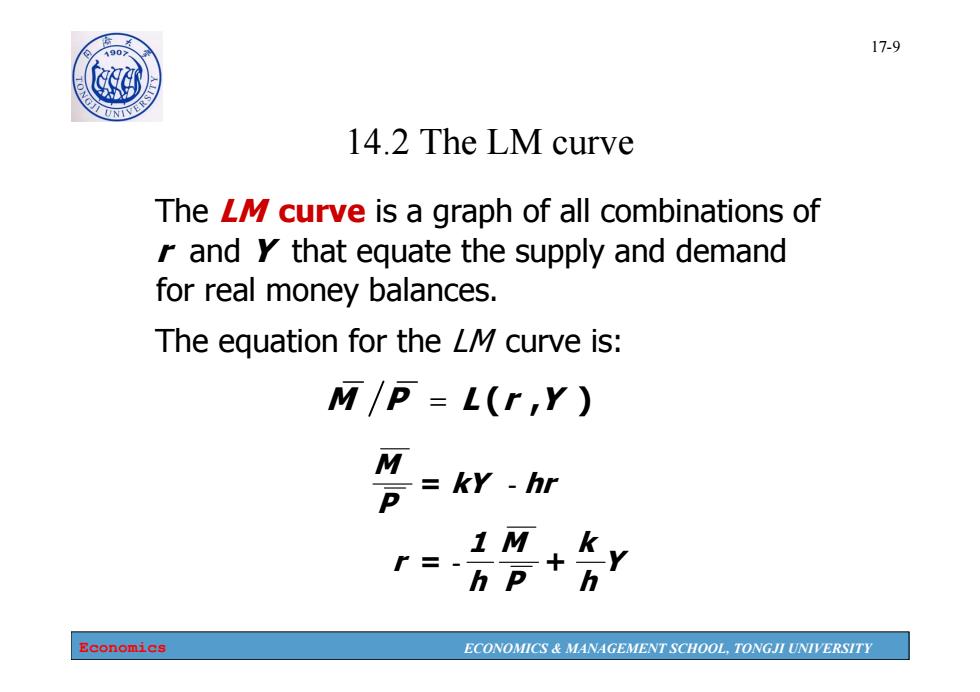
17-9 490 砂 14.2 The LM curve The LM curve is a graph of all combinations of rand y that equate the supply and demand for real money balances. The equation for the LM curve is: M/P=L(r Y) M kY-hr h P h Economics ECONOMICS MANAGEMENT SCHOOL,TONGJI UNIVERSITY
Economics ECONOMICS & MANAGEMENT SCHOOL, TONGJI UNIVERSITY 17-9 14.2 The LM curve M P LrY (, ) The LM curve is a graph of all combinations of r and Y that equate the supply and demand for real money balances. The equation for the LM curve is: Yhk PMh1 r kY hr P M = + = - -
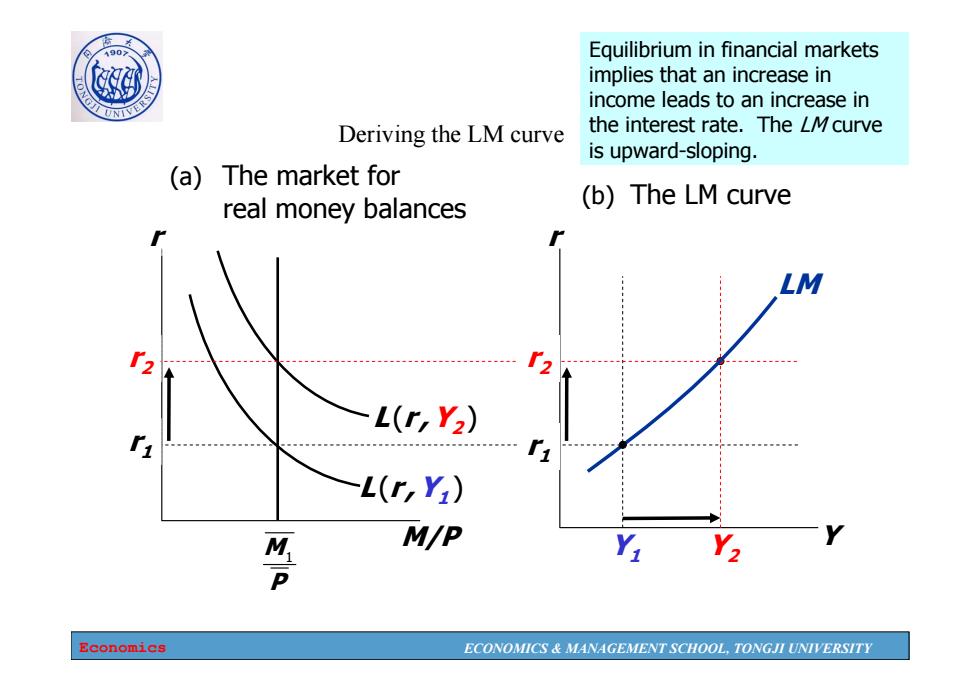
0 Equilibrium in financial markets implies that an increase in income leads to an increase in Deriving the LM curve the interest rate.The LMcurve is upward-sloping (a)The market for real money balances (b)The LM curve LM L(r,Y2) 《 L(r Y) 答 M/P Economics ECONOMICS MANAGEMENT SCHOOL,TONGJI UNIVERSITY
Economics ECONOMICS & MANAGEMENT SCHOOL, TONGJI UNIVERSITY 17-10 Deriving the LM curve M/P r M1 P L (r ,Y1) r1 r2 r Y Y1 r1 L (r ,Y2) r2 Y2 LM (a) The market for real money balances (b) The LM curve Equilibrium in financial markets implies that an increase in income leads to an increase in the interest rate. The LM curve is upward-sloping