3/2/2017 OSHA Statistics OSHA Statistics Women of Hispanic or Latino ethnicity Women of Hispanic or Latino ethnicity According to the US Bureau of Labor Statistics Fatal injuries among Latino men have declined fact sheet,"Workplace Injuries,Illnesses,and Fatalities to Women of Hispanic or Latino 29%while Latino women remained the same Ethnicity,2005-2009 -Occupational groups with highest fatal -Homicides account for 40%fatal work injuries incurred for Latino women injuries compared to 24%for non-Hispanic ·sales19% Latino women account for 11%of all fatal office and administration 13% occupational injuries incurred by women, roughly equal their percent of employed cleaning and maintenance 11% women fishing and forestry 11% OSHA Statistics Total=216 Workplace fatalities Violence continues to be a leading cause of on-the-job Falls.6 6 fatalities 1 in 5 fatalities are from homicide Homicide气42 Type of work employed may increase the homicide risk work with cash transactions increase homicide by 36 times higher than other employments 7 Supervisors and proprietors in sales have the highest rate Grocery stores have highest of all industries 16% Retail trade as a whole accounts for 45%of all homicides in 2000
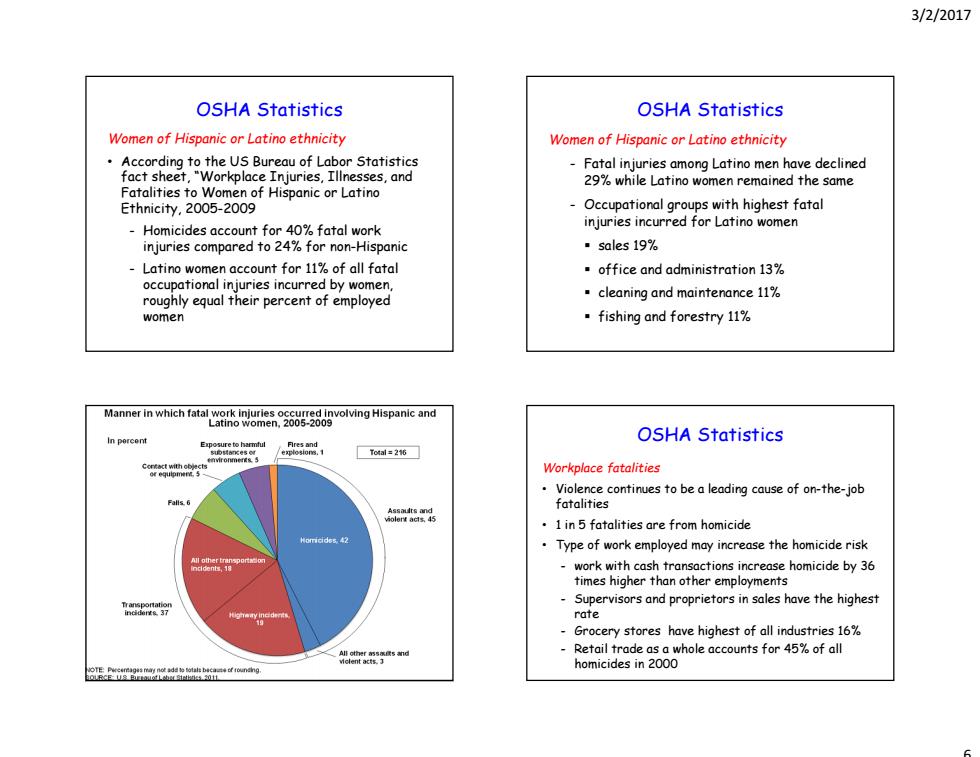
3/2/2017 6 OSHA Statistics Women of Hispanic or Latino ethnicity • According to the US Bureau of Labor Statistics fact sheet, “Workplace Injuries, Illnesses, and Fatalities to Women of Hispanic or Latino Ethnicity, 2005-2009 - Homicides account for 40% fatal work injuries compared to 24% for non-Hispanic - Latino women account for 11% of all fatal occupational injuries incurred by women, roughly equal their percent of employed women OSHA Statistics Women of Hispanic or Latino ethnicity - Fatal injuries among Latino men have declined 29% while Latino women remained the same - Occupational groups with highest fatal injuries incurred for Latino women sales 19% office and administration 13% cleaning and maintenance 11% fishing and forestry 11% OSHA Statistics Workplace fatalities • Violence continues to be a leading cause of on-the-job fatalities • 1 in 5 fatalities are from homicide • Type of work employed may increase the homicide risk - work with cash transactions increase homicide by 36 times higher than other employments - Supervisors and proprietors in sales have the highest rate - Grocery stores have highest of all industries 16% - Retail trade as a whole accounts for 45% of all homicides in 2000
3/2/2017 Violence at Work SEYEARCHAW Fatal oocupational injuries,by major event,2013* Fres and explosions 39t Did you know? Total-4,405 中中中中中 780 raut af 5 微 o6 Other Key Facts 1% 36% 39% Workplace homicides due to shootings,by industry,2010 Fatal injury events,by gender of worker,2008 1 Total 405 10
3/2/2017 7
3/2/2017 Workplace homicides due to shootings,by industry,2010 OSHA Statistics Retail trade sector Relatively safe industry to work -6%of total fatal injuries -14%of total nonfatal injuries Total 405 Characteristics that make it vulnerable to injury from criminal activity direct contact with the public exchange of money OSHA Statistics Percentage of workplace homicides in retail trade,by type of establishment 2003-2008 focdand beverage 41.4 Retail trade sector Gasoline station ☐22.0 Motor ·2008 othngnd othing General merchandise -117 homicides Miscellaneous -980 nonfatal assaults Sporting goods.hobby.book.and music 日30 2/3 of the homicides occurred in food and beverage stores and gas stations 1.6 15 Majority of the victims were foreign born Nonstore.4 77%of assailants were robbers 00 100 200 300 400
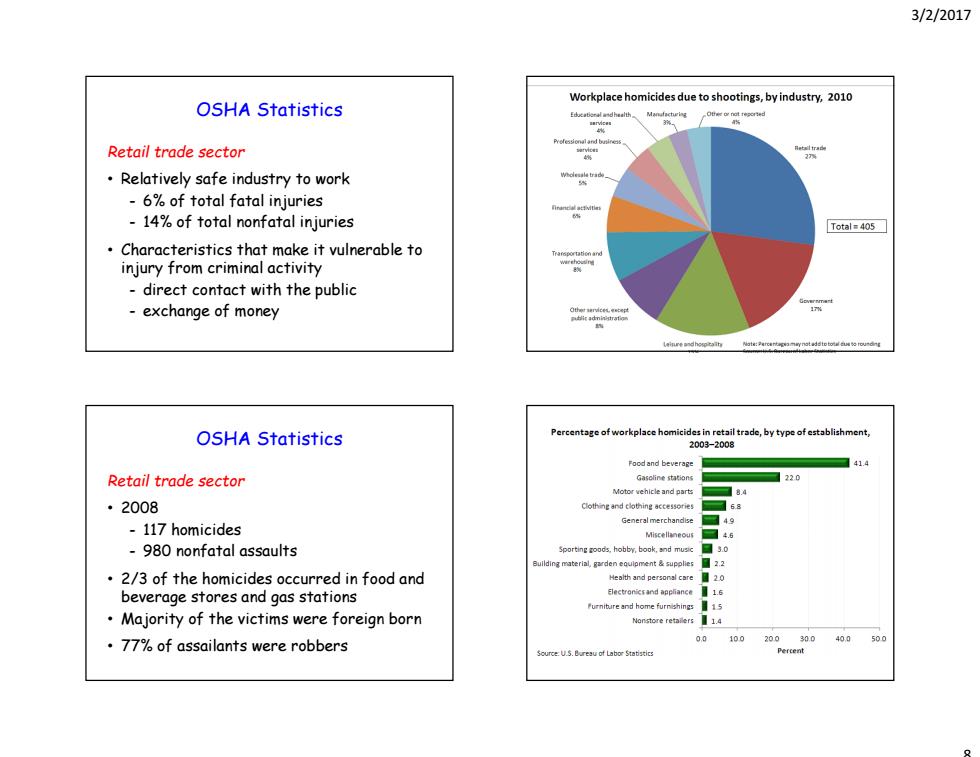
3/2/2017 8 OSHA Statistics Retail trade sector • Relatively safe industry to work - 6% of total fatal injuries - 14% of total nonfatal injuries • Characteristics that make it vulnerable to injury from criminal activity - direct contact with the public - exchange of money OSHA Statistics Retail trade sector • 2008 - 117 homicides - 980 nonfatal assaults • 2/3 of the homicides occurred in food and beverage stores and gas stations • Majority of the victims were foreign born • 77% of assailants were robbers
3/2/2017 OSHA Statistics Perecentage of fatal occupational injuries in private retail trade and in all other industries,by event,2003-2003 60 Retail trade sector 511 1/3 of fatal injuries are from shootings 5%of retail establishments reported a an 30 incidence of criminal violence in 2005 compared with 2%of all other industries 36,000 robberies occurred at gas stations 18 and convenience stores in 2008 85%of all retailers reported having been victimized in 2008 Soure:U.S.Bureau bor OSHA Statistics Workplace injuries and illnesses in food manufacturing and food service and drinking places,private industry,2003-2009 0 Food manufacturing Workers in food manufacturing are more likely to be -fatally injured and experience nonfatal 15 injuries and illness than workers in the 10 Food manufacturng.unes private industry suffer an injury requiring job transfer or restriction than one that requires days away from work 200320042005 206200720082009 ce:U.S Bureau of
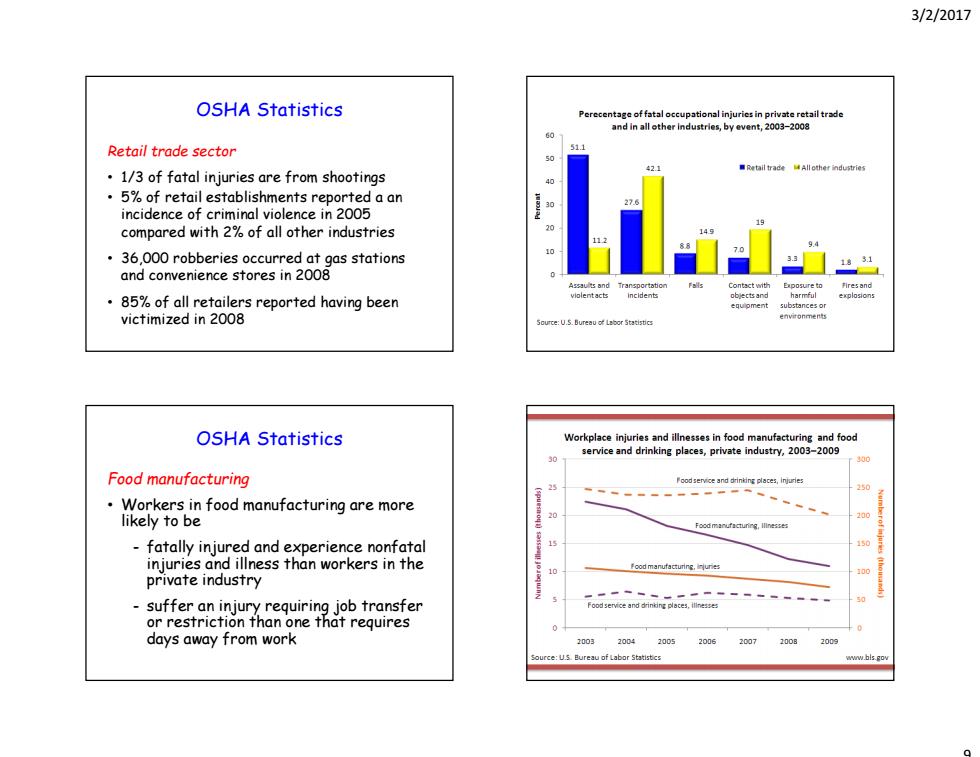
3/2/2017 9 OSHA Statistics Retail trade sector • 1/3 of fatal injuries are from shootings • 5% of retail establishments reported a an incidence of criminal violence in 2005 compared with 2% of all other industries • 36,000 robberies occurred at gas stations and convenience stores in 2008 • 85% of all retailers reported having been victimized in 2008 OSHA Statistics Food manufacturing • Workers in food manufacturing are more likely to be - fatally injured and experience nonfatal injuries and illness than workers in the private industry - suffer an injury requiring job transfer or restriction than one that requires days away from work