Mackinlay:Event Studies in Economics and Finance 17 ments where the actual earnings is in the For the statistical models,the assump- 5 percent range centered about the ex- tion that asset returns are jointly multi- pected earnings are designated as no variate normal and independently and news.Of the 600 announcements,189 identically distributed through time is are good news,173 are no news,and the imposed.This distributional assumption remaining 238 are bad news. is sufficient for the constant mean return With the announcements categorized, model and the market model to be cor- the next step is to specify the parameters rectly specified.While this assumption is of the empirical design to analyze the eq- strong,in practice it generally does not uity return,i.e.,the percent change in lead to problems because the assumption value of the equity.It is necessary to is empirically reasonable and inferences specify a length of observation interval, using the normal return models tend to an event window,and an estimation win- be robust to deviations from the assump- dow.For this example the interval is set tion.Also one can easily modify the sta- to one day,thus daily stock returns are tistical framework so that the analysis of used.A 41-day event window is em- the abnormal returns is autocorrelation ployed,comprised of 20 pre-event days, and heteroskedasticity consistent by us- the event day,and 20 post-event days. ing a generalized method-of-moments For each announcement the 250 trading approach. day period prior to the event window is used as the estimation window.After A.Constant Mean Return Model presenting the methodology of an event study,this example will be drawn upon Let u be the mean return for asset i. Then the constant mean return model is to illustrate the execution of a study. R,=4,+S (2) 4.Models for Measuring Normal E()=0 var ()=2. Performance where Ru is the period-t return on secu- A number of approaches are available rity i and it is the time period t distur- to calculate the normal return of a given bance term for security i with an expec- security.The approaches can be loosely tation of zero and varianceo grouped into two categories-statistical Although the constant mean return and economic.Models in the first cate- model is perhaps the simplest model, gory follow from statistical assumptions Brown and Warner (1980,1985)find it concerning the behavior of asset returns often yields results similar to those of and do not depend on any economic ar- more sophisticated models.This lack of guments.In contrast,models in the sec- sensitivity to the model can be attributed ond category rely on assumptions con- to the fact that the variance of the abnor- cerning investors'behavior and are not mal return is frequently not reduced based solely on statistical assumptions.It much by choosing a more sophisticated should,however,be noted that to use model.When using daily data the model economic models in practice it is neces- is typically applied to nominal returns. sary to add statistical assumptions.Thus With monthly data the model can be ap- the potential advantage of economic plied to real returns or excess returns models is not the absence of statistical (the return in excess of the nominal risk assumptions,but the opportunity to cal- free return generally measured using the culate more precise measures of the nor- U.S.Treasury Bill with one month to mal return using economic restrictions. maturity)as well as nominal returns
18 Journal of Economic Literature,Vol.XXXV (March 1997) B.Market Model The market model is an example of a one The market model is a statistical factor model.Other multifactor models model which relates the return of any include industry indexes in addition to given security to the return of the mar- the market.William Sharpe (1970)and ket portfolio.The model's linear specifi- Sharpe,Gordon Alexander,and Jeffery cation follows from the assumed joint Bailey(1995,p.303)provide discussion of index models with factors based on in- normality of asset returns.For any secu- rity i the market model is dustry classification.Another variant of a factor model is a procedure which calcu- Rr=0+β,Rmt+e0 (3) lates the abnormal return by taking the difference between the actual return and E(it=0) var()= a portfolio of firms of similar size,where where Rit and Rmt are the period-t re- size is measured by market value of eq- turns on security i and the market port- uity.In this approach typically ten size folio,respectively,and E is the zero groups are considered and the loading on the size portfolios is restricted to unity. mean disturbance term.di,Bi,and o2 are the parameters of the market model. This procedure implicitly assumes that In applications a broad based stock in- expected return is directly related to market value of equity. dex is used for the market portfolio, with the S&P 500 Index,the CRSP Generally,the gains from employing multifactor models for event studies are Value Weighted Index,and the CRSP limited.The reason for the limited gains Equal Weighted Index being popular is the empirical fact that the marginal choices. The market model represents a poten- explanatory power of additional factors the market factor is small,and hence, tial improvement over the constant mean there is little reduction in the variance of return model.By removing the portion the abnormal return.The variance re- of the return that is related to variation duction will typically be greatest in cases in the market's return,the variance of where the sample firms have a common the abnormal return is reduced.This in turn can lead to increased ability to de- characteristic,for example they are all tect event effects.The benefit from us- members of one industry or they are all ing the market model will depend upon firms concentrated in one market capi- talization group.In these cases the use the R2 of the market model regression. The higher the R2 the greater is the vari- of a multifactor model warrants consid- eration. ance reduction of the abnormal return, The use of other models is dictated by and the larger is the gain data availability.An example of a normal C.Other Statistical Models performance return model implemented in situations with limited data is the mar- A number of other statistical models ket-adjusted return model.For some have been proposed for modeling the events it is not feasible to have a pre- normal return.A general type of statisti- event estimation period for the normal cal model is the factor model.Factor model parameters,and a market-ad- models are motivated by the benefits of justed abnormal return is used.The mar- reducing the variance of the abnormal ket-adjusted return model can be viewed return by explaining more of the vari- as a restricted market model with o con- ation in the normal return.Typically the strained to be zero andβ;constrained to factors are portfolios of traded securities. be one.Because the model coefficients
MacKinlay:Event Studies in Economics and Finance 19 are prespecified,an estimation period is motivated by the Arbitrage Pricing not required to obtain parameter esti- Theory.A general finding is that with mates.An example of when such a model the APT the most important factor be- is used is in studies of the under pricing haves like a market factor and additional of initial public offerings.Jay Ritter factors add relatively little explanatory (1991)presents such an example.A gen- power.Thus the gains from using an eral recommendation is to only use such APT motivated model versus the market restricted models if necessary,and if model are small.See Stephen Brown necessary,consider the possibility of bi- and Mark Weinstein (1985)for further ases arising from the imposition of the discussion.The main potential gain restrictions. from using a model based on the arbi- D.Economic Models trage pricing theory is to eliminate the biases introduced by using the CAPM. Economic models can be cast as re- However,because the statistically moti- strictions on the statistical models to vated models also eliminate these bi- provide more constrained normal return ases,for event studies such models models.Two common economic models dominate. which provide restrictions are the Capi- tal Asset Pricing Model(CAPM)and the 5.Measuring and Analyzing Abnormal Arbitrage Pricing Theory (APT).The Returns CAPM due to Sharpe (1964)and John Lintner (1965)is an equilibrium theory In this section the problem of measur- where the expected return of a given as- ing and analyzing abnormal returns is set is determined by its covariance with considered.The framework is developed the market portfolio.The APT due to using the market model as the normal Stephen Ross(1976)is an asset pricing performance return model.The analysis theory where the expected return of a is virtually identical for the constant given asset is a linear combination of mean return model. multiple risk factors. Some notation is first defined to facili- The use of the Capital Asset Pricing tate the measurement and analysis of ab- Model is common in event studies of the normal returns.Returns will be indexed 1970s.However,deviations from the in event time using t.Defining t=0 as CAPM have been discovered,implying the event date,t=T+1 to t=T2 repre- that the validity of the restrictions im- sents the event window,and t=To+1 to posed by the CAPM on the market t=T constitutes the estimation window. model is questionable.2 This has intro- Let L1=TI-To and L2=T2-TI be the duced the possibility that the results length of the estimation window and the of the studies may be sensitive to the event window respectively.Even if the specific CAPM restrictions.Because event being considered is anan- this potential for sensitivity can be nouncement on given date it is typical to avoided at little cost by using the market set the event window length to be larger model,the use of the CAPM has almost than one.This facilitates the use of ab- ceased. normal returns around the event day in Similarly,other studies have employed the analysis.When applicable,the post- multifactor normal performance models event window will be from t=T2+1 to t=Ts and of length L3=T3-T2.The tim- 2 Eugene Fama and Kenneth French (1996) ing sequence is illustrated with a time provide discussion of these anomalies. line in Figure 1
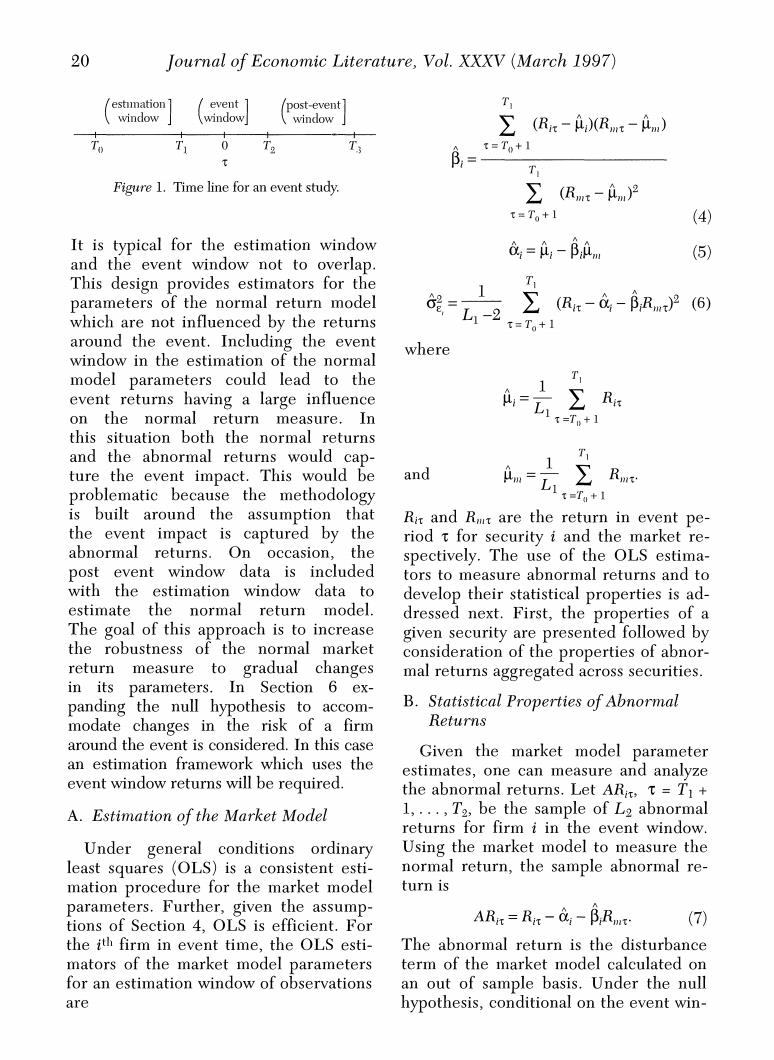
20 Journal of Economic Literature,Vol.XXXV(March 1997) estimation event post-event window window window ∑(Rr-ARmt-in) T 0 T B,= t=To+l Figure 1.Time line for an event study. ∑(Rn-in月 t=To+l (4) It is typical for the estimation window =A-Bm (5) and the event window not to overlap. This design provides estimators for the parameters of the normal return model 至风-4-航护同 which are not influenced by the returns t=T。+1 around the event.Including the event where window in the estimation of the normal model parameters could lead to the T event returns having a large influence on the normal return measure.In this situation both the normal returns and the abnormal returns would cap- T 1 ture the event impact.This would be and problematic because the methodology mii =T4+1 is built around the assumption that Rit and Rmt are the return in event pe- the event impact is captured by the riod t for security i and the market re- abnormal returns.On occasion,the spectively.The use of the OLS estima- post event window data is included tors to measure abnormal returns and to with the estimation window data to develop their statistical properties is ad- estimate the normal return model. dressed next.First,the properties of a The goal of this approach is to increase given security are presented followed by the robustness of the normal market consideration of the properties of abnor- return measure to gradual changes mal returns aggregated across securities. in its parameters.In Section 6 ex- panding the null hypothesis to accom- B. Statistical Properties of Abnormal modate changes in the risk of a firm Returns around the event is considered.In this case Given the market model parameter an estimation framework which uses the estimates,one can measure and analyze event window returns will be required. the abnormal returns.Let ARit,t=TI+ A.Estimation of the Market Model 1,...,T2,be the sample of L2 abnormal returns for firm i in the event window. Under general conditions ordinary Using the market model to measure the least squares(OLS)is a consistent esti- normal return,the sample abnormal re- mation procedure for the market model turn is parameters.Further,given the assump- tions of Section 4,OLS is efficient.For ARit =Rit-a-B.Rmt (7) the ith firm in event time,the OLS esti- The abnormal return is the disturbance mators of the market model parameters term of the market model calculated on for an estimation window of observations an out of sample basis.Under the null are hypothesis,conditional on the event win-

MacKinlay:Event Studies in Economics and Finance 21 dow market returns,the abnormal re- overall inferences for the event of inter- turns will be jointly normally distributed est.The aggregation is along two dimen- with a zero conditional mean and condi- sions-through time and across securi- ional variance o2(ARnt)where ties.We will first consider aggregation through time for an individual security o2R)=呢+ 1 (Bt-m) 6品 (8) and then will consider aggregation both across securities and through time.The From (8),the conditional variance has concept of a cumulative abnormal return two components.One component is the is necessary to accommodate a multiple disturbance variance o2 from(3)and a period event window.Define CAR(t,t2) second component is additional variance as the sample cumulative abnormal re- due to the sampling error in ai and Bi. turn (CAR)from t to t2 where This sampling error,which is common T1<t1≤t2≤T2.The CAR from t1tot2is for all the event window observations, the sum of the included abnormal re- also leads to serial correlation of the turns, abnormal returns despite the fact that the true disturbances are independent CAR,(1t)=∑AR (10) through time.As the length of the esti- T=T mation window LI becomes large,the second term approaches zero as the sam- pling error of the parameters vanishes. Asymptotically (as Li increases)the vari- ance of CAR,is The variance of the abnormal return will be o and the abnormal return observa- (t1,t2)=(亿2-t1+1)2 (11) tions will become independent through time.In practice,the estimation window This large sample estimator of the vari- ance can be used for reasonable values of can usually be chosen to be large enough to make it reasonable to assume that the L1.However,for small values of LI the contribution of the second component to variance of the cumulative abnormal re- the variance of the abnormal return is turn should be adjusted for the effects of the estimation error in the normal model zero. Under the null hypothesis,Ho,that parameters.This adjustment involves the second term of (8)and a further related the event has no impact on the be- adjustment for the serial covariance of havior of returns (mean or variance) the distributional properties of the the abnormal return. abnormal returns can be used to draw The distribution of the cumulative ab- inferences over any period within the normal return under Ho is event window.Under Ho the distribu- CAR(t1,t2)~N(0,t1,t2) (12) tion of the sample abnormal return of a given observation in the event window is Given the null distributions of the abnor- mal return and the cumulative abnormal ARit-N(0,2(AR)). (9) return,tests of the null hypothesis can be conducted. Next(9)is built upon to consider the ag- However,tests with one event obser- gregation of the abnormal returns. vation are not likely to be useful so it is C.Aggregation of Abnormal Returns necessary to aggregate.The abnormal re- turn observations must be aggregated for The abnormal return observations the event window and across observa- must be aggregated in order to draw tions of the event.For this aggregation